Stellar (XLM) Primed for $0.16 Breakout - Here’s Why It Matters

Stellar's consolidation pattern tightens as technical indicators flash bullish signals across the board.
The Setup
XLM has been coiling beneath resistance levels for weeks, building energy for what traders call a 'compression breakout.' Volume patterns suggest institutional accumulation while retail sentiment remains cautiously optimistic. The $0.16 target represents not just a psychological barrier but a key technical level that could trigger cascading buy orders.
Market Mechanics
Stellar's blockchain fundamentals continue outpacing traditional finance rails - settling cross-border payments in seconds while legacy systems still argue about settlement times. The network's recent partnership expansions create real-world utility that actually justifies price movements, unlike certain meme coins that rise because a celebrity changed their profile picture.
Breaking Through
Watch for volume confirmation above average daily levels. False breakouts plague impatient traders, but sustained momentum above $0.12 could fuel the run to $0.16. Remember when Wall Street analysts needed Excel models to predict price movements? Now we just watch order book liquidity and pray the Fed doesn't tweet during lunch hour.
Stellar's moment approaches as traditional finance scrambles to keep up with technology it still doesn't understand.

The chart structure shows growing pressure on resistance, and anticipation is rising across the market. A breakout at this stage could set the tone for he asset’s next big move, opening the path toward higher price levels.
Stellar Approaches Critical Breakout Zone
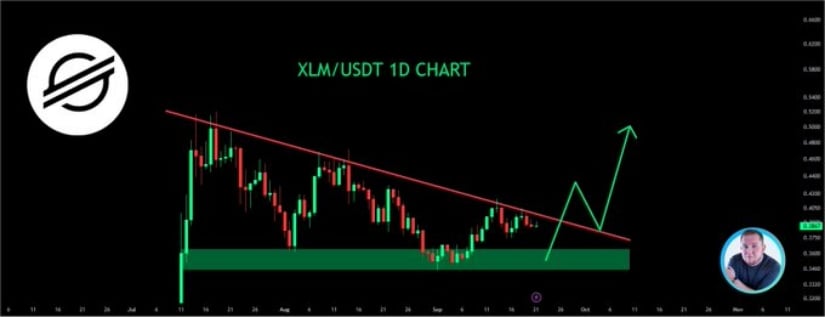
In a recent X post, analyst CryptoJack described XLM as “ready to explode,” pointing to a tightening structure on the daily chart. The token has been moving within a descending trendline since July, consistently rejecting attempts to break higher. At the same time, a strong accumulation zone between $0.105 and $0.115 has acted as reliable support, showing that sellers are gradually losing strength.
Source: X
The chart illustrates a squeeze pattern forming as the descending resistance line converges with horizontal support. Historically, such setups have led to sharp directional moves, and in this case, the bias leans toward a bullish breakout. If the coin clears the trendline around the $0.12 level, buyers could quickly push toward $0.14, with potential extension toward $0.16 should momentum build further.
Market attention is now centered on whether the token can sustain pressure at this resistance. Failure to break out may lead to a retest of the $0.10 area, but the recent price structure suggests buyers are in a stronger position. With volume expected to increase once the breakout occurs, the coin’s next MOVE could set the tone for its performance heading into October.
Breakout Signals Strengthen as Market Data Confirms Pressure
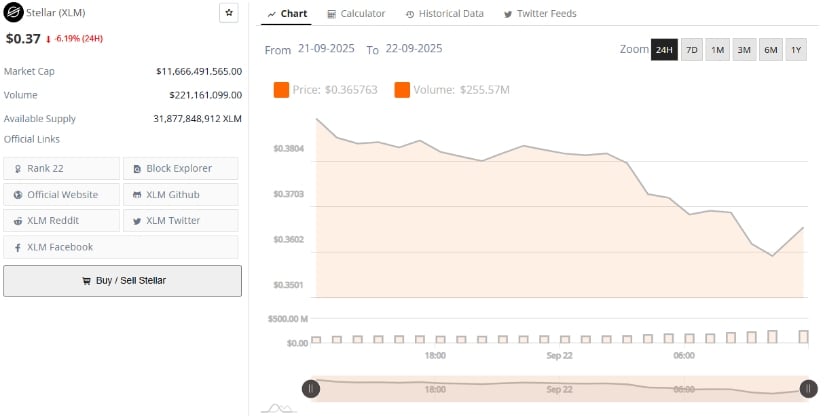
Supporting the analyst view, BraveNewCoin data shows the asset trading at $0.37, down 6.19% in the past 24 hours, with a market capitalization of $11.66 billion.
The decline has not erased its strong position in the market, as daily trading volume of $221 million reflects sustained participation despite the short-term dip. This balance between pressure on price and ongoing liquidity suggests that the setup for a breakout remains valid.
Source: BraveNewCoin
The latest trading range highlights activity between $0.35 and $0.38, where buyers are working to defend support around the lower boundary. While momentum currently favors sellers, holding above $0.36 WOULD strengthen the case for recovery. If resistance at $0.38 is cleared, the path toward higher levels, such as $0.4, may open, aligning with the technical breakout expectations shared by analysts.
Technical Outlook Signals Weakness in Momentum
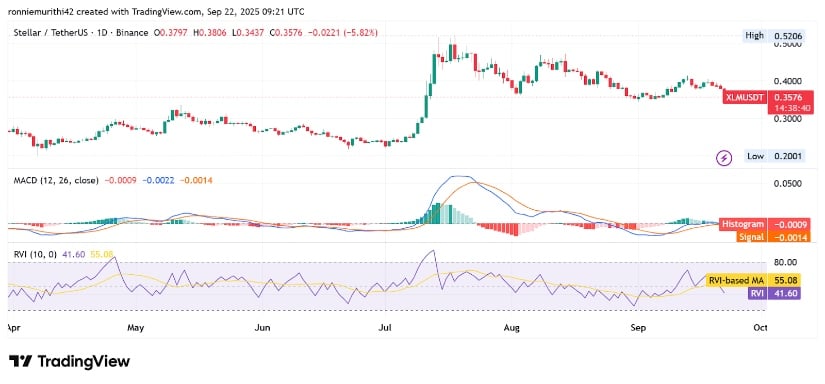
At the time of writing, the price is trading at $0.358, reflecting a 5.72% decline over the past 24 hours. The recent drop followed resistance NEAR $0.38, with support now holding around $0.34. Market structure shows consolidation after a sharp rally in August that peaked above $0.52, with the current pullback suggesting a cooling phase where buyers are yet to regain control.
Source: TradingView
Momentum indicators reinforce this cautious view. The MACD lines remain flat near the zero mark, signaling limited bullish pressure, while the Relative Vigor Index sits at 41.65 against its moving average of 55.08, highlighting weakening buyer conviction. If price holds above the $0.34–$0.35 range, recovery prospects remain intact, but a breakdown below this support could expose the $0.32 zone as the next key level.
