Optimism Price Surge Signals Potential Rebound After Market Pullback

Optimism's native token defies broader market weakness with a stunning 24-hour surge—just when traders needed hope most.
Market Mechanics: The Rebound Blueprint
Technical indicators flash bullish as buying pressure overwhelms recent sell-offs. Trading volume spikes 40% while open interest suggests institutional accumulation beneath retail panic.
Ecosystem Momentum: Beyond Price Action
Layer-2 activity hits record highs as developers flock to Optimism's scaling solutions. Daily transactions surpass Ethereum's mainnet—because who enjoys paying $100 gas fees for a swap?
Macro Outlook: The Crypto Cycle Accelerates
Traditional finance veterans still can't decide if crypto's a revolution or Ponzi scheme—meanwhile, Optimism's treasury grows faster than their compliance departments can regulate it.
This isn't just a dead cat bounce. It's the market reminding everyone that fundamentals eventually trump fear.

According to analyst TriptoX, Optimism faces a crucial resistance zone between $0.87 and $0.95.
Surpassing this level could trigger significant bullish momentum, while failure to break through may limit short-term growth. Currently priced at $1.08, the altcoin is nearing this critical resistance range, making this an essential point for market participants to monitor.
SpartanTrading also highlights the asset’s recent bounce from its lows, signaling potential for a short-term recovery. With a notable increase in trading volume and price fluctuations, it is showing signs of investor interest and bullish sentiment. If momentum continues, the project could be poised for an upward breakout, making it a key asset to watch in the upcoming trading sessions.
Resistance Levels and Price Movement
According to analyst TriptoX, Optimism is currently at a critical price level. The key resistance zone lies between $0.87 and $0.95, which will be pivotal for determining if the asset can sustain upward momentum.
The project has shown an ability to rebound in the past, but overcoming this resistance zone is crucial for a breakout to higher levels. With the current price hovering around $1.08, it is NEAR the lower end of this resistance range, making this a critical zone to monitor.
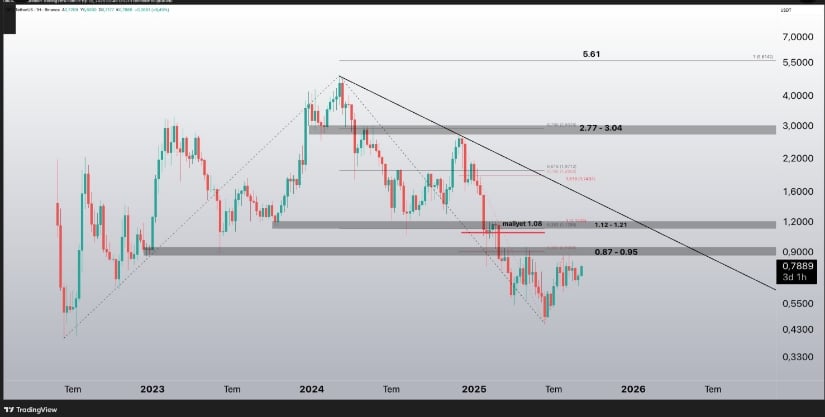
OP Chart | Source:x
The price movement will largely depend on whether it can break through this resistance zone. If the asset manages to surpass the $0.95 range, the likelihood of further price increases could be higher. On the other hand, should the price remain within this zone, it might face challenges in pushing above the resistance, limiting the short-term gains.
Recent Recovery Attempt
In a recent tweet, SpartanTrading noted that $OP had bounced off its lows and was being closely watched by market participants. The price had experienced a significant drop earlier, followed by a recovery attempt, suggesting that there might be potential for a rebound.
Spartan highlighted the consolidation near the bottom, which could signal that it is preparing for another move. If momentum picks up, the asset could see higher levels in the near term.
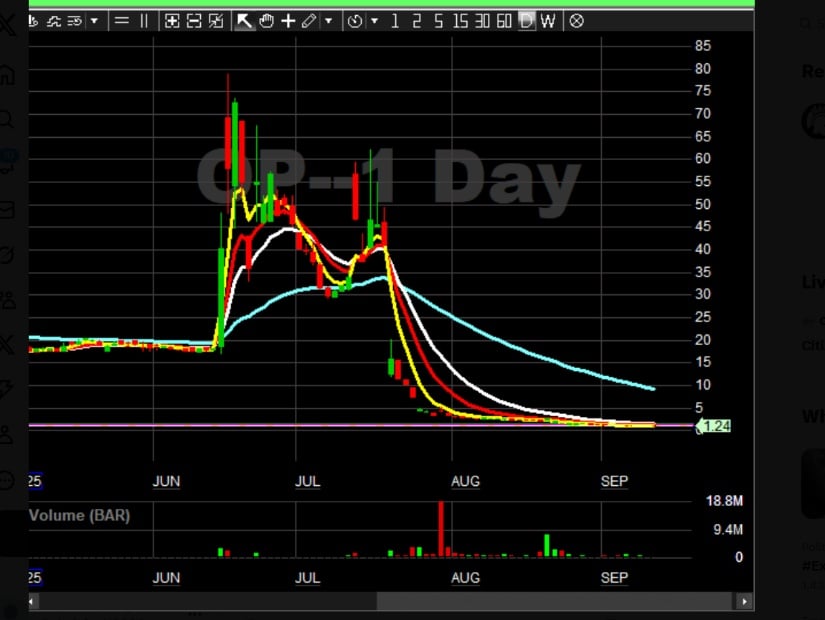
OP Chart | Source:x
The optimism chart reflects a positive shift in the market sentiment, especially after bouncing off its lows. The recovery from the previous price drop indicates that the market is evaluating whether it has reached a support level strong enough to initiate a rebound. As the asset moves through the lower levels, the price action suggests that it may be positioning itself for a short-term rally, especially if the support holds and buyers step in.
Volume Surge and Market Sentiment
Over the 24 hours, the crypto shows a sharp increase in its price, rising from $0.775 to $0.79. This surge appears to have been accompanied by a noticeable rise in trading volume, suggesting heightened interest. The increase in buy-side activity between 12:00 and 18:00 points to positive investor sentiment, which could indicate growing demand for the asset.
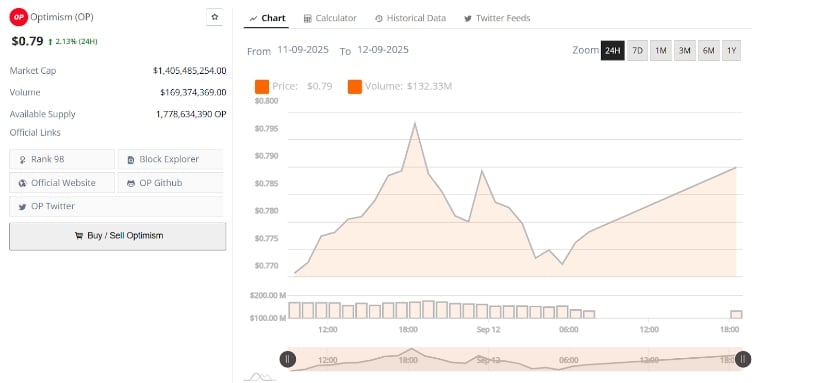
OP 24-Hr Chart | Source: BraveNewCoin
However, following the surge, the price stabilized near $0.79, and the volume trend showed a slight decline. This could imply that some profit-taking took place after the initial price spike. While the price has paused near the peak of its movement, the overall market sentiment surrounding it remains positive. As long as buying interest persists, there remains strong potential for further gains, especially if the asset can break past the resistance zones outlined earlier.
Key Levels to Watch
The resistance zone between $0.87 and $0.95 could determine whether it is able to break out and sustain upward momentum. Given the recent price surge and the increased trading volume, the market may be positioning itself for a continuation of the rally, though confirmation will come once the asset pushes past the resistance zone.
The price action remains dynamic, with consolidation at the lower levels indicating the possibility of a rebound. If buying interest continues to grow, it could see further upward movement in the short term. However, any failure to break through the resistance levels could result in further consolidation or a potential pullback.
