FLOKI Price Rebound Gains Strength With $82M Volume Surge and Technical Breakout

FLOKI just flipped the script—$82 million in fresh volume pours in as bulls break key resistance levels.
Technical Breakthrough Confirmed
The meme coin isn’t just bouncing—it’s breaking out. Chart watchers see a classic bullish pattern playing out, with momentum building fast. No fluke, no fakeout. This move’s got legs.
Volume Tells the Real Story
Eighty-two million dollars doesn’t lie. That kind of inflow screams conviction, not just speculation. Traders are piling in, betting this isn’t another dead-cat bounce. Because in crypto, volume is the only truth—everything else is noise.
What’s Next for FLOKI?
If momentum holds, we could be looking at a run toward higher highs. But let’s be real—this is crypto. One minute you’re riding a volume surge, the next you’re explaining to your friends why ‘utility’ matters. Stay sharp, take profits, and never forget: even a breakout can break your heart.

Recent price charts and market performance data highlight a potential reversal from the prolonged downtrend, suggesting that the coin could be entering a phase of sustained upward movement.
Traders and investors alike are paying close attention to the critical price and volume levels that could define the memecoin’s next rally stage.
Technical Breakout Signals Bullish Reversal in Price Action
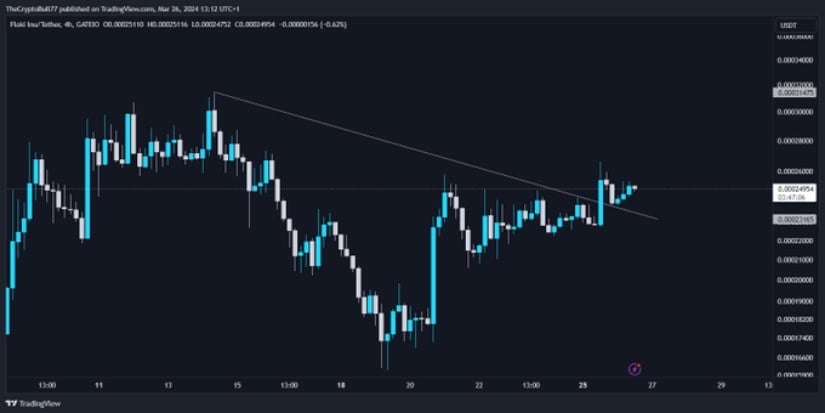
A chart shared by crypto Peer (@Wgist2) on X depicts FLOKI’s price attempting a breakout above a descending resistance trendline after an extended downtrend. The breakout zone around $0.00002400 emerges as a crucial level where consolidation and buying pressure converge, signaling potential market dominance.
Source: X
Crypto Peer emphasizes that this clear break above resistance reflects renewed buyer confidence, reducing prior selling pressure. Maintaining momentum beyond this threshold could attract additional market participants attracted by the reversal signal.
If the breakout sustains, the cryptocurrency may target the next resistance near $0.00002800. However, failure to hold this breakout level risks a pullback to the strong support area around $0.00002100. Confirming this breakout with high trading volume will be essential for validating the bullish scenario.
Market Data Shows Strong Liquidity and Participation Amid Volatility
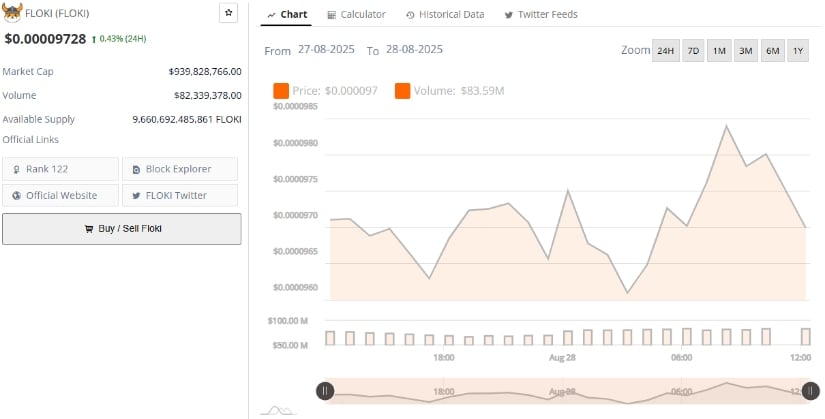
Additionally, BraveNewCoin data dated August 28, 2025, illustrates FLOKI trading at approximately $0.00009728 with a market capitalization of $939.8 million. Daily trading volume surged to $82.3 million, evidencing robust liquidity and active trader engagement.
Source: BraveNewCoin
Over the preceding 24 hours, the price fluctuated between $0.0000960 and $0.0000985, exhibiting volatility, while volume spikes coincided with price advances. This pattern suggests accumulation by larger investors or whales, possibly positioning for continued upward momentum.
The token’s market rank stands at 122, reflecting moderate traction in the competitive altcoin landscape. A breakthrough in both volume, surpassing $100 million, and price, moving toward a $1 billion market cap, WOULD mark significant milestones. The sustainability of this momentum in both measures will be key for the token’s further ascent.
Bollinger Bands and MACD Reveal Mixed Signals With Potential for Rebound
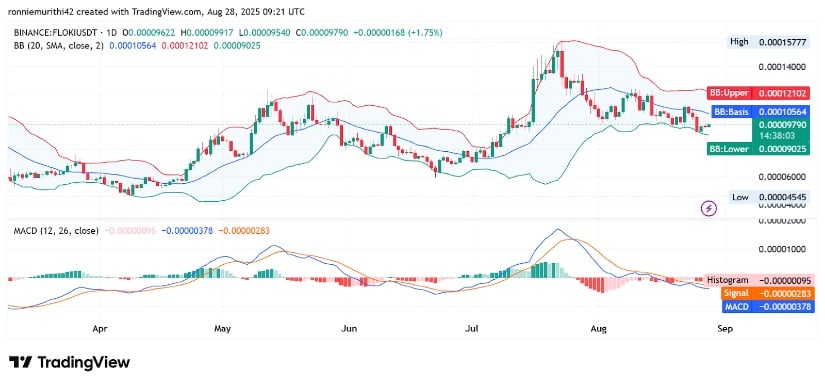
On the other hand, Technical analysis from TradingView applies Bollinger Bands and the MACD indicator to assess memecoin’s volatility and momentum. At $0.00009803, FLOKI trades NEAR the lower Bollinger Band ($0.00009027), suggesting the token is at a key support region that might precede a rebound.
Source: TradingView
The MACD illustrates a bearish crossover, with the signal line positioned above the MACD line, indicating current bearish momentum. Nonetheless, the narrowing histogram bars signify that this bearish pressure is waning. Should momentum shift, the asset could MOVE toward the Bollinger midline around $0.00010564.
A sustained close above $0.000098 accompanied by positive MACD divergence would further strengthen prospects for retesting the upper Bollinger Band near $0.0001210, marking a stronger recovery phase. On the downside, dipping below $0.000090 could expose the asset to increased selling pressure and potential declines.
