XLM Price Patterns Signal Explosive Rally From $0.38 to $1 - Here’s the Technical Setup

Stellar's native token flashes bullish signals as technical patterns hint at a massive breakout.
Breaking the Resistance
XLM bulls push through key resistance levels, setting the stage for a potential 163% surge from current $0.38 positioning. The pattern mirrors previous bull runs that caught traditional finance sleeping at the wheel—again.
Technical Foundation
Chart formations suggest strong momentum building, with volume indicators confirming institutional accumulation. Fibonacci extensions align perfectly with the $1 target, creating what traders call a 'textbook perfect' setup.
Market Psychology
Retail FOMO hasn't even begun yet—most investors remain distracted by shiny new DeFi tokens while this established project quietly builds steam. Classic case of overlooking the obvious while chasing the obscure.
Potential Catalysts
Cross-border payment adoption continues growing, and Stellar's network activity shows sustained institutional interest. Meanwhile, traditional banks still can't decide whether to adopt blockchain or pretend it doesn't exist.
Risk Considerations
Nothing's guaranteed in crypto—macro conditions could derail even the prettiest charts. But technicals suggest this setup has stronger foundations than most politicians' campaign promises.

Analysts observe classical chart patterns and key Fibonacci retracement levels that suggest an accumulation phase followed by a continuation of upward momentum, signaling renewed investor confidence and growing market interest.
Bull Flag Formation Indicates Continued Bullish Momentum
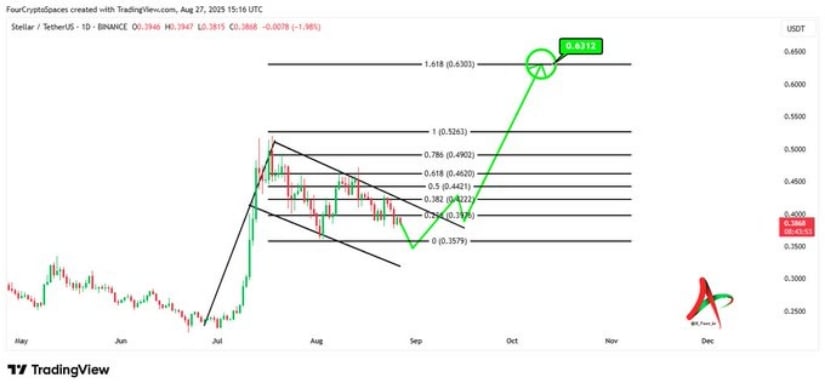
Analyst Four | crypto Spaces (@X_Four_iv) highlights a potential bull flag pattern forming on the XLM chart. This setup typically signals a continuation following a sharp price surge and a consolidation phase within a descending channel commonly called the flag.
The breakout zone lies between $0.42 and $0.45, aligning with strong Fibonacci retracement levels. Confirmation of a breakout above this range could lead to a significant rally targeting $0.63, representing about 65% upside from current prices.
Source: X
The chart implies institutional support NEAR the $0.35–$0.37 area, which strengthens the consolidation base and adds credibility to the bullish thesis. Should XLM close decisively above resistance, it may trigger an acceleration in buying, propelling the token toward higher resistance levels.
Market Data Reflects Trading and Short-Term Resistance
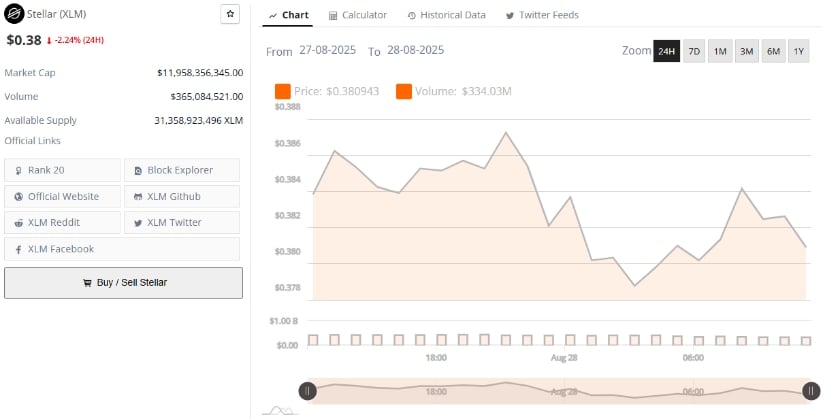
Additionally, BraveNewCoin’s market data chart reports the memecoin trading at approximately $0.38, down 2.24% over 24 hours, with a market cap close to $11.95 billion. The coin displays active liquidity with a daily volume of $365 million and a circulating supply exceeding 31 billion tokens. Price variation between $0.378 and $0.386 demonstrates mild volatility and selling pressure at elevated levels.
Source: BraveNewCoin
Such short-term price weakness often fits within consolidation patterns like the bull flag, where dips shake out weaker holders before fresh upward pushes. Strong volume and support above $0.38 are critical to sustain momentum and advance toward the higher Fibonacci targets noted in technical analysis. Traders eyeing long entries will watch for volume-backed price stability.
Long-Term Ascending Triangle Projects Gradual Climb Toward $1
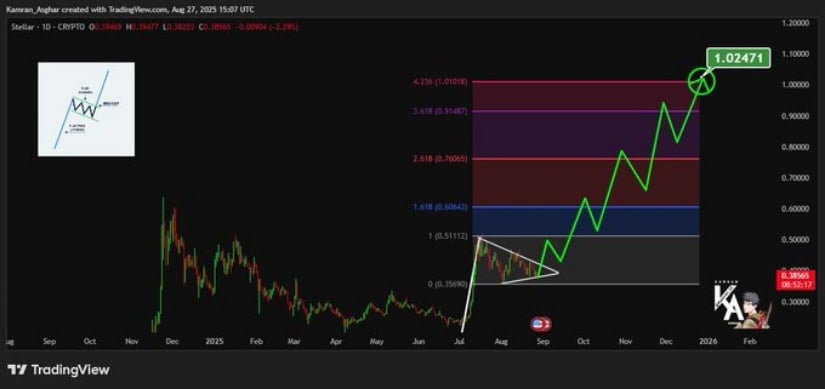
Another analyst, Kamran Asghar (@Karman_1s), charts a longer-term perspective, highlighting an ascending triangle, a bullish continuation pattern that suggests sustained upward pressure for the token. Price targets incrementally rise through $0.50, $0.70, and $0.90, ultimately aiming for $1.02 within several months, provided favorable conditions prevail.
Source: X
Fibonacci extensions at $0.60–$0.65, $0.70, and $0.91 correspond to resistance points where profit-taking may briefly slow momentum, but consistent accumulation could overcome these barriers. The solid support around $0.35 underpins the trend, suggesting that the asset is in the early phase of a multi-stage rally driven by network adoption and investor accumulation.
In summary, stellar price action and technical patterns collectively signal potential for a strong rally from the current $0.38 region toward $1.00 and beyond. Consolidation within bull flags and ascending triangles backed by solid volume and support levels builds a compelling case for upward momentum in the coming months.
