SEI Market Cap Nears $1.8B With Technicals Suggesting Breakout Potential

SEI rockets toward $1.8 billion market cap as technical indicators flash bullish signals—traders eye potential breakout above critical resistance levels.
Technical Momentum Builds
Chart patterns show consolidation near key psychological barriers—RSI holding strong without overbought signals. Volume spikes suggest institutional interest brewing beneath the surface.
Market Positioning
While traditional finance debates rate cuts, SEI's infrastructure play captures developer momentum. The token defies broader crypto lethargy—because nothing says 'value' like another layer-1 competing in a saturated market.
Breakout or Breakdown?
All eyes on the $1.8B threshold. A clean breach could trigger algorithmic buying waves—failure here might see retracement to recent supports. Either way, volatility's coming—because what's crypto without a little heartburn?

Comparisons with historic cycles of similar projects and current price action indicate that the asset may be in the final stages of accumulation before a significant upward move, provided key resistance levels are cleared and momentum sustains.
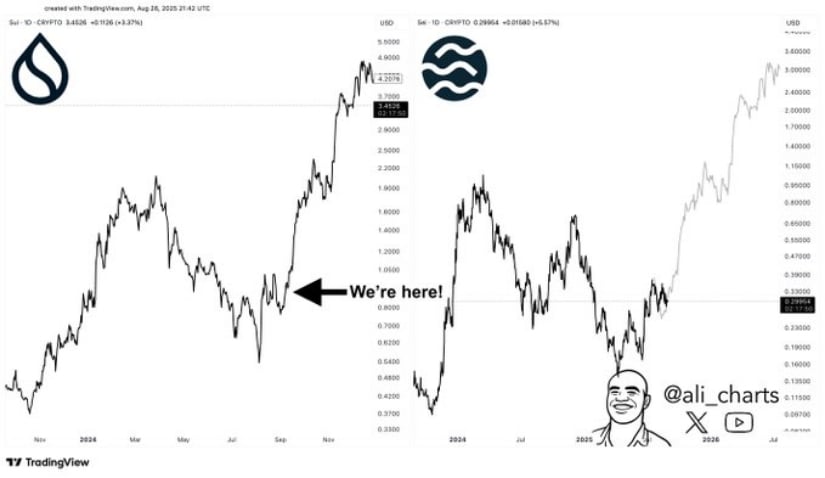
Fractal Comparison with SUI Signals Early Breakout Phase
Analyst Ali (@ali_charts) notes that SEI’s current price structure closely mirrors SUI’s earlier consolidation before its sharp rally. Positioned at a similar “buy zone,” the coin is forming higher lows while pressing against resistance, signaling accumulation and building momentum.
This resemblance suggests that the cryptocurrency could experience a similar explosive rally if it successfully sustains buying interest and broader market conditions remain favorable.
Source: X
Though fractal patterns offer useful reference points, caution remains warranted as outcomes depend on liquidity, investor confidence, and market dynamics. The token’s capacity to maintain momentum through this critical juncture will determine whether it breaks out decisively or undergoes further consolidation.
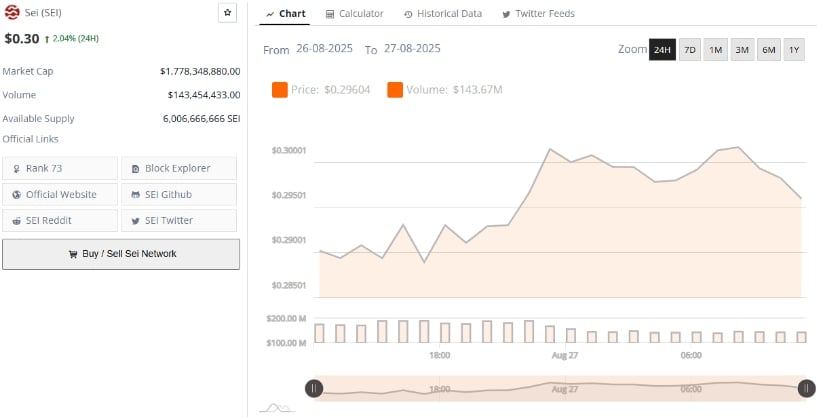
Market Snapshot Shows Renewed Buying Near Resistance
BraveNewCoin’s market data places SEI at approximately $0.30, up 2.04% over 24 hours, with a market cap of around $1.77 billion. The trading volume of $143.45 million highlights sustained participation amid price moves from NEAR $0.285 to just above $0.30.
While late-session profit-taking caused slight pullbacks near resistance, the overall scenario reflects buyer attempts to push higher.
Source: BraveNewCoin
Closing above the $0.30 resistance on renewed volume exceeding $150 million WOULD strengthen the case for a breakout. Investors are displaying cautious optimism, monitoring if the token can hold recent gains and build towards further price appreciation.
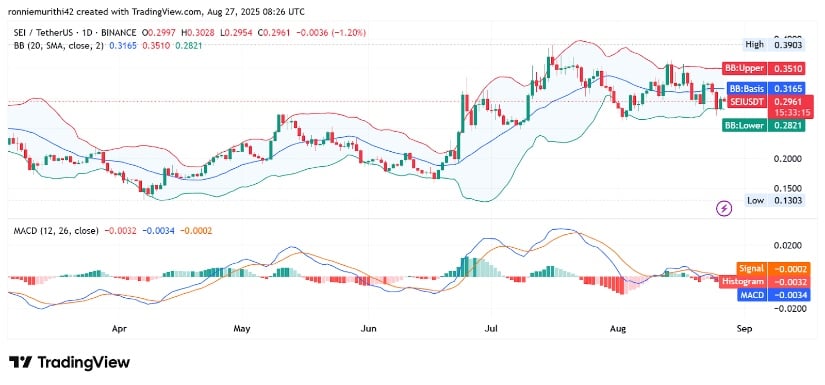
Technical Indicators Point to Consolidation
On the daily timeframe, TradingView charts reveal SEI trading near $0.296 after a modest decline, with Bollinger Bands tightening between $0.282 and $0.316. Price testing the lower band signals a risk of downward pressure if support fails, while the MACD remains in negative territory, indicating ongoing bearish momentum.
Source: TradingView
A daily close above the Bollinger midline near $0.316 would suggest a bullish recovery in progress, but failure to hold $0.282 support could expose the asset to deeper corrections. Traders should watch MACD momentum closely for signs of reversal that could confirm an upcoming breakout phase.
In conclusion, the coin approach to key resistance levels amid fractal accumulation patterns and active market participation points to promising breakout potential. Careful monitoring of price and volume around $0.30 and momentum indicators will be essential as the asset seeks to convert current consolidation into a robust upward trajectory.
