Uniswap Defies Odds: Price Holds Firm at $10 as On-Chain Data Signals Capitulation Nearing Market Bottoms
Uniswap's resilience at the $10 mark defies broader market pessimism as on-chain metrics flash classic bottom signals.
Decoding The Capitulation Signals
Blockchain analytics reveal textbook capitulation patterns—transaction volumes spike while active addresses show exhaustion. That $10 support level isn't just psychological; it's where smart money accumulates while weak hands fold. Network activity suggests retail dumping has nearly run its course.
The Institutional Whisper
Whale transactions tell a different story from retail panic. Large wallets keep accumulating at these levels, betting against the herd mentality. They've seen this movie before: maximum fear often precedes violent rallies. The data screams accumulation, not distribution.
Technical Vs Fundamental Reality
While traditional finance still debates whether crypto has 'real value,' chain analytics prove capital flows don't lie. Decentralized exchanges aren't just surviving—they're eating centralized competitors' lunch during volatility spikes. Guess those 3 AM FTX flashbacks still haunt traditional finance bros.
Bottom fishing requires nerves of steel when everyone screams crash. But history favors those who buy when blood's in the streets—even if that blood is mostly algorithmic traders liquidating each other.

Analysis of supply distribution patterns, market activity, and momentum points to resilient buying interest emerging after significant selling pressure, suggesting the coin may be positioned for a recovery if key levels hold.
On-Chain Supply Distribution Highlights Strong Holder Support
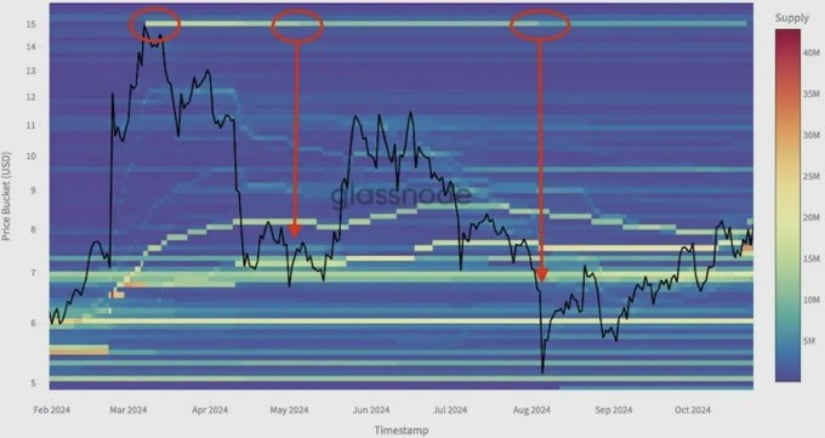
A recent on-chain supply distribution chart from analyst Teresa depicts how UNI’s token supply has shifted in 2024, showing concentrated holdings around the $15 level that gradually thinned as holders exited positions.
Red-circled points on the chart mark capitulation events where distressed sellers offloaded their tokens, leading to downward shifts in supply from weaker hands to more resilient accumulators. This redistribution points to market stress periods but also marks phases where price bottoms tend to form.

Source: X
The data suggests that selling pressure has begun to ease, with supply stabilizing at lower levels where stronger hands now hold the tokens. This dynamic is a classic capitulation fingerprint, implying that the asset’s price floors are becoming more reliable.
Unless broader market sentiment deteriorates further, the on-chain data indicate the coin’s downside is increasingly supported by long-term holders, limiting further sharp declines.
Market Snapshot Shows Consolidation with Active Volume and Moderate Gains
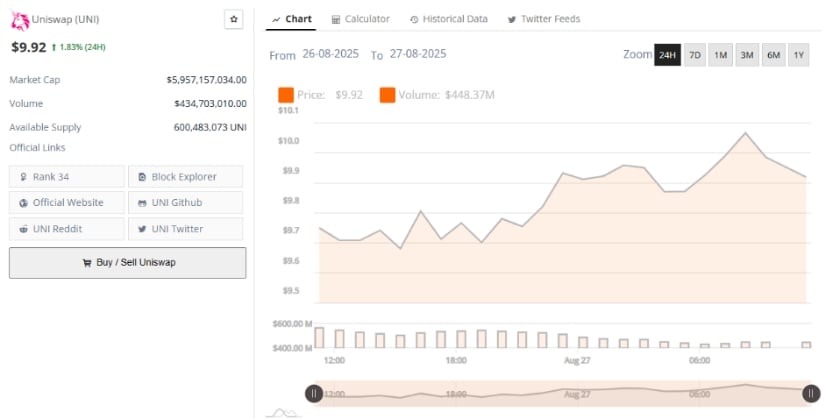
According to BraveNewCoin, UNI’s market price is currently $9.92, reflecting a modest 1.83% gain while the market cap sits NEAR $5.95 billion. Daily trading volume exceeds $434 million, underpinning strong liquidity and investor engagement despite price stalling just below the psychological $10 barrier. Intraday highs reached $10.10 before a mild pullback, indicating resistance at higher levels.

Source: BraveNewCoin
Volume spikes coincide with upward moves, suggesting buying interest defending support between $9.70 and $9.90. This sustained liquidity provides a platform for accumulation around $10, increasing the likelihood of a breakout, provided volume holds or increases.
Failure to maintain these support levels could invite retracements toward $9.50, while a confirmed push above $10.10 may open doors toward $11–$12.
Technical Indicators Reflect Consolidation and Potential for Directional Breakout
On the other hand, TradingView’s analysis using Bollinger Bands places UNI near the midline of a narrowing range, with upper and lower bands at $11.99 and $9.58, respectively. The current price oscillating near the basis reflects trader indecision, with notable support at $9.50 and resistance close to $12.
Meanwhile, the MACD indicator points to fading bullish momentum, with the MACD line slightly above the signal line but a negative histogram signaling weakening buying pressure.

Source: TradingView
Recent high-volatility candles following rejection from $12.30 reinforce the technical hurdles ahead. For bullish continuation, the memecoin must reclaim and sustain price above $11. A drop below $9.50 support risks deeper pullbacks.
Overall, the charts indicate a sideways consolidation likely to resolve soon, with volume and momentum shifts crucial in determining the next significant trend.

