Uniswap Battles Critical $15.5 Resistance as Crypto Markets Hold Breath

DeFi's liquidity kingpin hits a major inflection point.
Uniswap's native token faces its ultimate test at the $15.5 threshold—a level that could determine its next major directional move. The entire decentralized exchange ecosystem watches as UNI consolidates beneath this technical ceiling.
Market mechanics at play
Resistance levels don't lie. The $15.5 barrier represents accumulated sell orders and psychological resistance from previous cycles. Breaking through requires either massive volume or catalyst-driven momentum—neither of which comes cheap in current market conditions.
Consolidation patterns suggest accumulation
While sideways action bores retail traders, smart money recognizes these patterns as potential springboards. The longer UNI consolidates beneath resistance, the more explosive the eventual breakout—if it comes.
Traders face their moment of truth
Watch for volume spikes and order book depth around $15.5. Thin liquidity above could trigger rapid price discovery, while rejection could send UNI back to test lower supports. Either way—volatility's coming.
Another day in crypto markets where technical levels matter more than fundamentals—because when did utility ever pump a token?

Market volume and momentum indicators suggest that while bullish interest persists, a decisive breakout or breakdown is needed to set the next trend direction.
Range-Bound Price Action and Volume Trends Highlight Consolidation
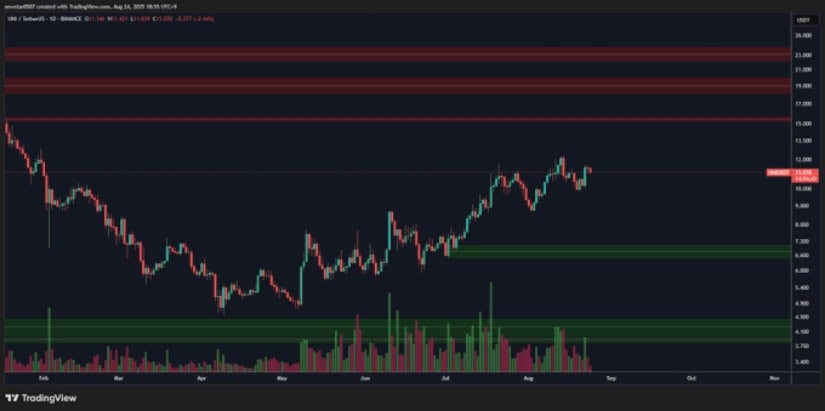
UNI’s price chart shows a clear range between support around $8 and resistance NEAR $15.5. Since March, the market has seen periods of both upward momentum and accumulation, with a peak near $12 signaling testing of higher resistance levels. The volume spike in May points to increased institutional engagement, possibly fueling the price surge at that time.
Source: X
More recently, volume has tapered somewhat but remains sufficient to sustain the current price levels, indicating a consolidation phase. The price hovering near the mid-range, around $10, reflects a critical crossroads where the market could either advance toward resistance or retest support. Traders and investors should watch carefully for any break beyond these levels to identify future market direction.
Short-Term Price Movement Shows Neutral Sentiment Amid Stable Volume
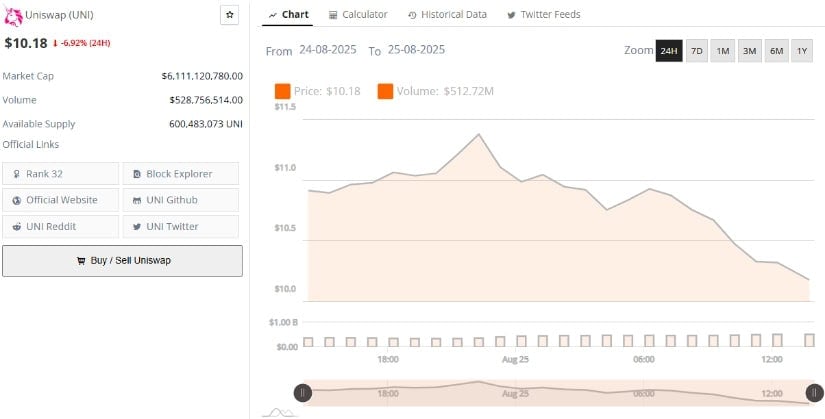
On one hand, BraveNewCoin’s data shows UNI fluctuating between $9.7 and $12.3, with the current price near $10.18. This narrow trading range and lack of clear direction suggest that the market is consolidating, with neither buyers nor sellers holding decisive control. Despite efforts to push past resistance, the asset has encountered selling pressure, keeping price action contained.
Source: BraveNewCoin
Volume remains steady but has slightly declined recently, indicating a pause in trading activity as participants await new catalysts. This lack of conviction from market participants reinforces the neutral stance, with sustained buying needed to break above $12.3 and push toward $15.5. If the price falls below current levels, the token may revisit support near $9.7, prolonging the consolidation phase.
Technical Indicators Signal Volatility with Potential Momentum Shift
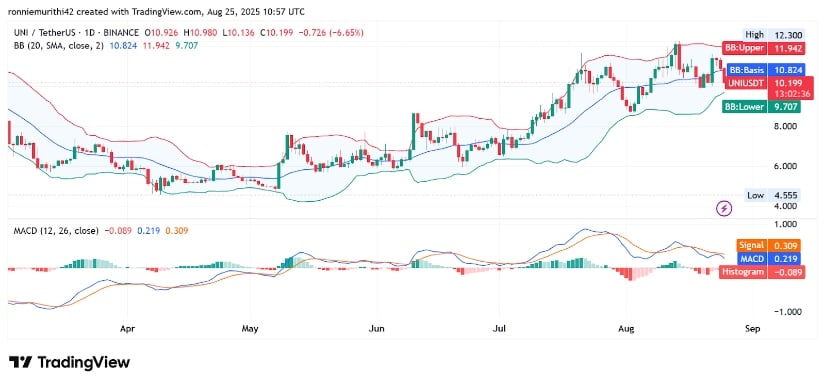
On the other hand, TradingView’s analysis using Bollinger Bands and MACD sheds light on the current momentum. UNI’s price is near the upper Bollinger Band boundary around $12.3, often a signal of overextension and potential resistance. Failure to break this level may precipitate a pullback or sideways consolidation.
Source: TradingView
The MACD displays bullish characteristics, with the MACD line above the signal line since early August, reflecting accumulated buying pressure. However, signs of weakening momentum emerge as the histogram begins to trend negatively, indicating that the rally might be losing steam. This divergence raises caution for traders, suggesting the possibility of a short-term reversal if the price cannot maintain above the Bollinger Bands’ midline near $10.82.
In summary, the asset price is consolidating between key support and resistance levels, facing strong barriers near $15.5 while showing mixed momentum signals. Traders should monitor the $12.3 resistance and $10.82 support closely to confirm whether a breakout or correction will define the next phase for the coin price movement.
