HBAR Price Targets $0.30 Breakout: Analysts Predict Massive 2025 Surge

Hedera's native token eyes critical resistance level as momentum builds.
Technical Breakout Imminent
HBAR consolidates below the $0.30 barrier—a level that's become crypto's latest psychological battleground. Analysts spot bullish patterns forming across multiple timeframes, suggesting accumulation by institutional players who've finally discovered something besides Bitcoin.
2025 Projections: Beyond Predictable Hype
While most altcoins recycle empty promises, HBAR's enterprise-grade network actually processes real transactions. The token's infrastructure partnerships—often buried under louder, shinier competitors—finally gain traction as traditional finance wakes up to blockchain utility beyond speculative gambling.
Market Cycles Favor Fundamentals
Next bull run won't reward pure memes. Projects with actual revenue models and governance structures position HBAR for outperformance. Of course, this assumes crypto investors suddenly develop attention spans longer than a TikTok video.
Regulatory Tailwinds or Headfakes?
Clearer regulatory frameworks could catapult compliant networks like Hedera—or bury them under bureaucracy designed by people who still think 'crypto' means hiding money in offshore safety deposit boxes.

This optimistic outlook suggests that a breakout above this level could trigger a multi-wave surge, attracting greater market attention and positioning the asset for a strong performance within the cryptocurrency space.
Analyst Predicts Breakout and Explosive Rally Ahead
A chart shared by analyst @Steph_iscrypto on X outlines a bullish scenario for HBAR, showing the token moving steadily within an upward channel over the past months. The resistance NEAR $0.30 is identified as a pivotal level; the breakout beyond this point could spur an explosive rally, with price targets moving significantly higher in 2025.
The projected price path implies that such a breakout WOULD not be a simple spike but potentially a multi-wave uptrend capable of drawing interest from institutional investors.
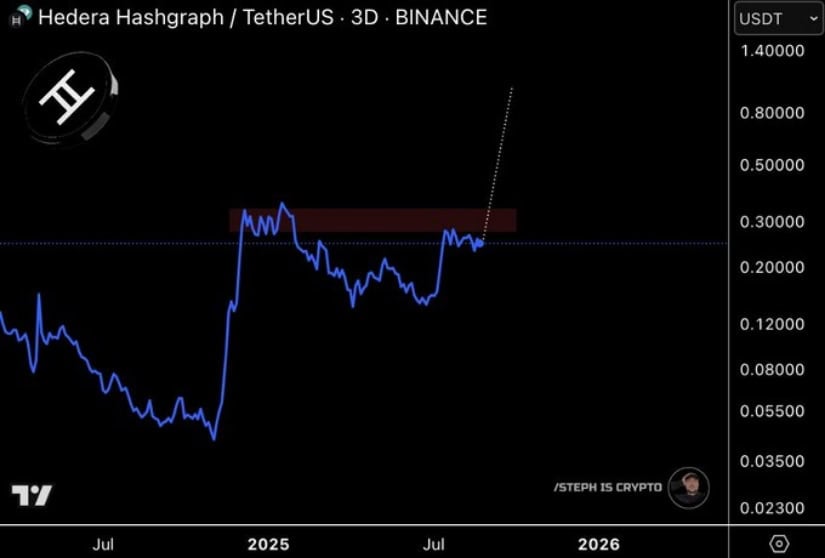
Source: X
The analyst warns, however, that while the technical setup is promising, broader cryptocurrency market trends and the tokens’ project developments will play crucial roles in confirming this move. Market corrections or unforeseen events could delay or alter the breakout timing. Yet, the bullish fractal pattern embodies considerable upside potential, encouraging traders to keep a close watch on price action as it approaches this critical zone.
Market Data Reveals Consolidation Amidst High Trading Activity
Additionally, BraveNewCoin’s recent market data captured HBAR trading between $0.24 and $0.26, with a slight dip to $0.23, indicating some short-term resistance near recent highs. Despite the fluctuations, an impressive trading volume of $365 million signals active involvement from traders and investors.
The relatively narrow price range and high volume suggest a phase of consolidation, where buyers and sellers are evenly matched, awaiting a decisive catalyst.
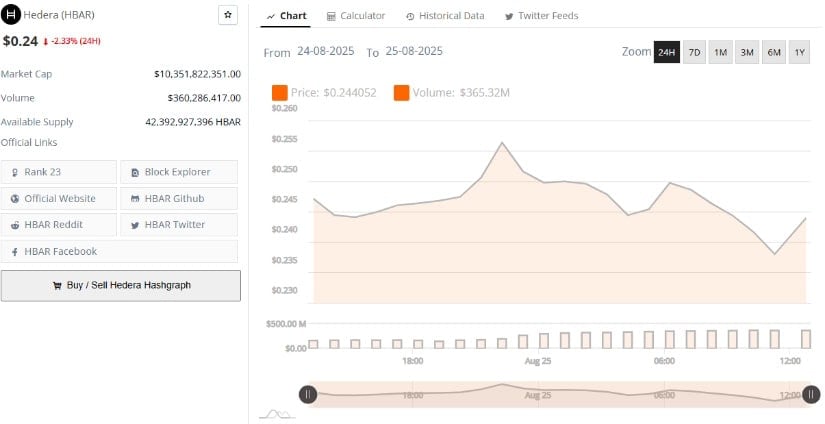
Source: BraveNewCoin
Price action in this window points toward market indecision, but the sustained trading activity supports the notion that the token remains a favored asset. Breaking above resistance at $0.26 could rekindle bullish momentum, potentially precipitating a stronger upward move. Conversely, failure to maintain this level may extend the consolidation phase or trigger pullbacks, making this a crucial zone for near-term price direction.
Technical Indicators Signal Caution Amid Momentum Divergence
On the other hand, the TradingView chart incorporating Bollinger Bands and MACD provides nuanced insights into HBAR’s momentum and volatility.
The price is approaching the upper Bollinger Band, indicating that the token may soon enter overbought territory. Historically, this band often acts as a resistance zone, where price rallies pause or reverse, prompting traders to watch closely for signs of exhaustion or pullback.
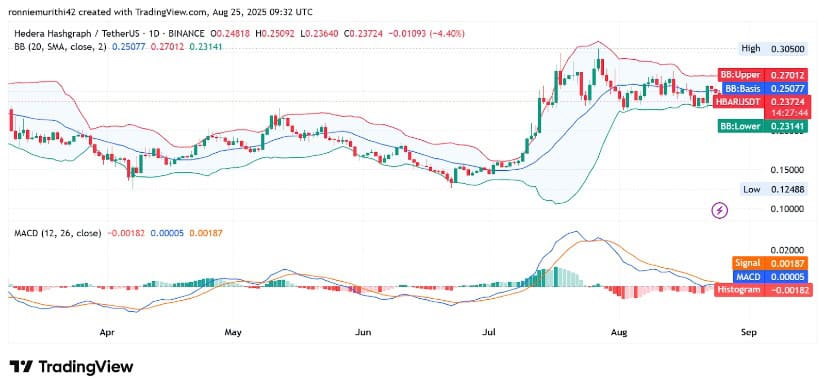
Source: TradingView
MACD indicators indicate a slight negative divergence between price and momentum, with the histogram displaying a mild downward trend. This signals the current upward MOVE may be losing steam. Should the MACD line cross below the signal line, a short-term correction or consolidation could unfold before any renewed push.
However, a breakout above the upper Bollinger Band would affirm strong bullish momentum, targeting the next resistance zones.
