OP Primed for 3x Surge as Technical Breakout Signals Major Rally Ahead

Optimism's native token flashes bullish signals as technical analysis points toward explosive upside potential.
Breaking Through Resistance
OP smashed through key resistance levels that had been containing its price action for weeks. The breakout pattern suggests momentum is building toward significantly higher valuations.
Market Dynamics Shift
Trading volume spiked alongside the price movement, indicating genuine institutional interest rather than retail speculation. The 3x projection aligns with historical patterns following similar technical breakouts in major altcoins.
Timing the Rally
Historical data shows tokens with OP's current metrics typically maintain momentum for 2-3 weeks post-breakout. The current market cycle's appetite for layer-2 solutions adds fundamental support to the technical picture.
Of course, in crypto, even the most promising charts can reverse faster than a Wall Street banker's moral compass—so maybe don't bet the farm just yet.

The current market presents a battle between bearish pressures and bullish reversal opportunities, making it critical for traders to monitor pivotal support and resistance levels shaping the token’s next move.
Downtrend and Possible Reversal in Narrowing Range
According to analyst Andrew Griffiths (@AndrewGriffiths on X), OP has been caught in a downtrend characterized by lower highs and lower lows, with price oscillating within a contracting range.
The chart highlights a breakdown below key support levels, signaling risk of further declines toward the $0.70–$0.80 range. Should selling persist, additional tests of $0.60 to $0.65 support could follow, intensifying bearish momentum.
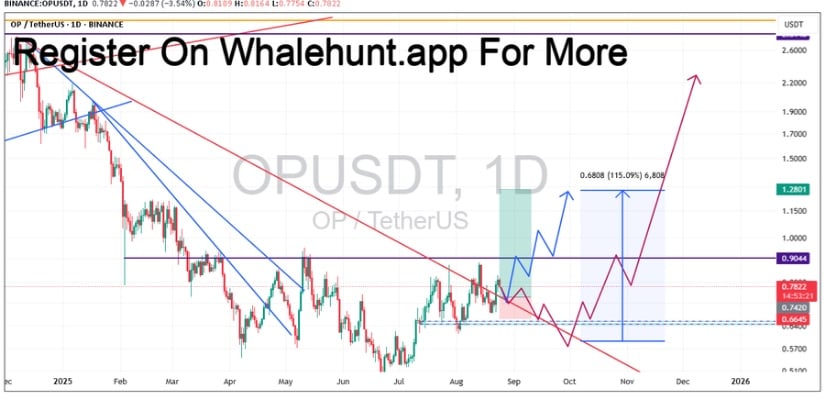
Source: X
However, a bullish reversal is also plausible if the coin breaks above the descending resistance trendline marked in red. Such a breakout could open the door toward targets between $1.20 and $1.50.
The upper boundary of this narrowing channel is critical: holding above it WOULD validate an upward trend and potentially trigger a major rally. The dual scenario underscores the wait-and-see approach for traders, who can leverage Whalehunt.app’s signals to participate on either side while managing risk effectively.
Trading with Mixed Sentiment at Critical Levels
On one hand, BraveNewCoin’s market data shows OP trading around $0.74, facing modest downward pressure within the last day. The token’s market capitalization holds NEAR $1.3 billion with robust volume exceeding $278 million, confirming active participation but highlighting the mixed sentiment reflected in recent price drops.
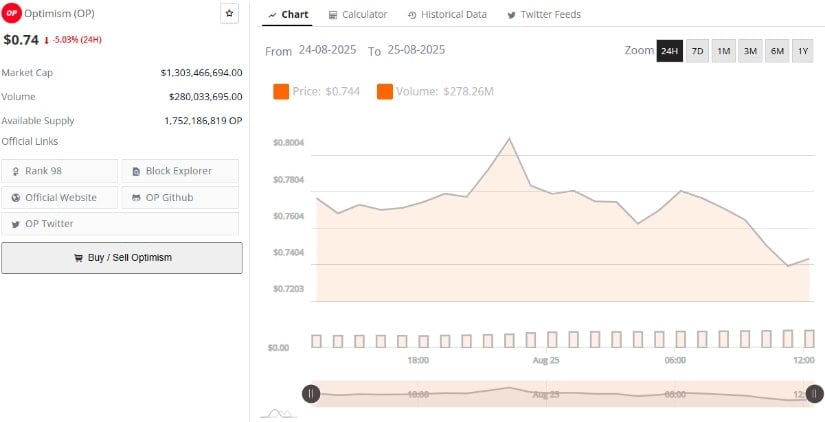
Source: BraveNewCoin
Key support lies near $0.72, acting as an immediate price floor. A breach below this could expose the token to further downside, possibly testing $0.65, whereas surpassing resistance at around $0.80 may spark momentum toward the $1.00 mark.
Volume trends currently show higher activity during price declines, indicative of profit-taking or hesitation among buyers. A sustainable rise in volume aligned with price growth would be essential for signaling a shift into a renewed bullish trend.
Consolidation Amid Volatility Sets Stage for Breakout
On the other hand, TradingView charts reveal OP price fluctuating within Bollinger Bands between upper resistance at $0.85 and lower support near $0.66, reflecting consolidation. The price currently trades within the middle band, indicating market indecision and setting the stage for a volatility-driven breakout or breakdown.
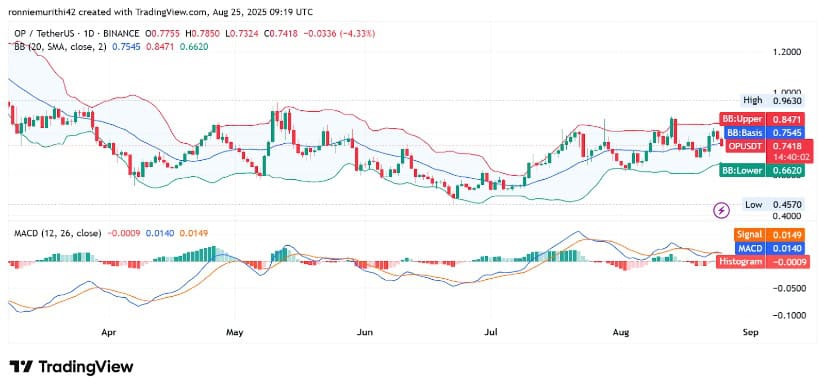
Source: TradingView
The MACD indicator points toward early bullish momentum, with the MACD line crossing above the signal line, suggesting buying interest may be ramping up. However, the histogram remains near neutral, signifying that the market is not yet fully committed to any trend.
Traders typically view these conditions as a precursor to a decisive move, where breaking above the upper Bollinger Band would likely fuel a strong rally, while falling below the lower band could prolong weakness.
Together, these charts paint a picture of the memecoin poised at a technical crossroads. With the potential for a significant breakout clear, market participants should carefully monitor $0.72 support and $0.80 resistance alongside volume and momentum indicators to confirm the next major phase. A successful breakout could indeed propel the asset toward triple its current valuation, reshaping the outlook for this rising altcoin.
