Dogwifhat Price Prediction: Bullish Inverted Head and Shoulders Pattern Targets $0.925

Dogwifhat's chart flashes a classic reversal signal—traders are taking notice.
The inverted head and shoulders pattern just broke neckline resistance, setting up a potential surge toward that $0.925 target. Technical analysts point to the clean formation as confirmation that the meme coin's recent consolidation phase might be over.
Volume confirms the breakout, with buyers stepping in aggressively above key support levels. Momentum indicators align—RSI holding strong without overbought conditions, MACD crossing bullish on the daily timeframe.
Of course, in crypto-land, even the prettiest patterns can get rug-pulled by a whale's whimsy. But for now, the charts suggest Dogwifhat's barking up the right tree—just don't bet your mortgage on a dog-themed token, unless you enjoy explaining that to your financial advisor.

This setup, combined with price action and momentum analysis, suggests that the token may be preparing to rally towards $0.925—provided key levels and volume support confirm the move.
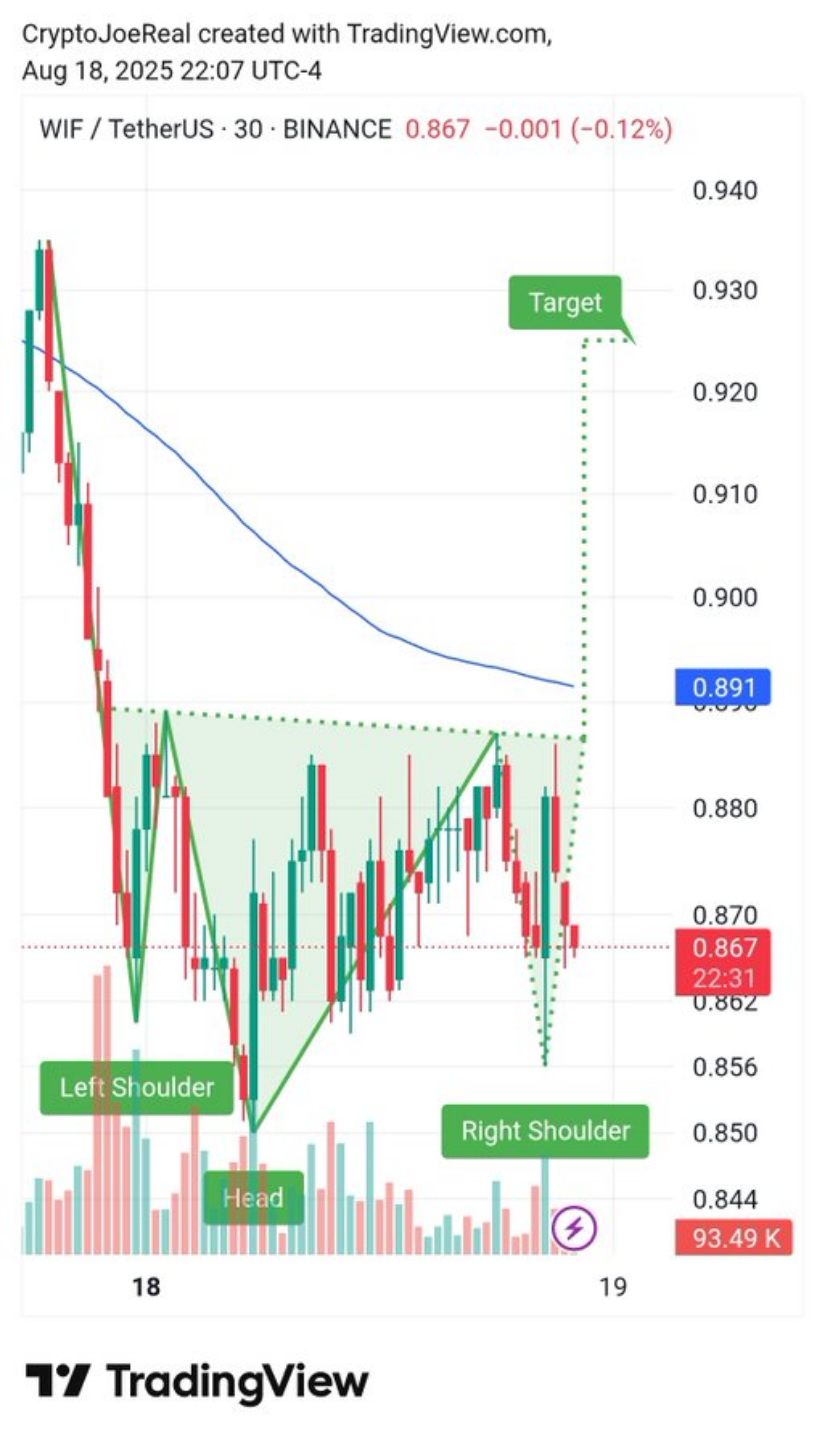
Inverted Head and Shoulders Pattern Signals Possible Reversal
The 30-minute chart of WIF/TetherUS reveals a well-defined inverted head and shoulders pattern. The pattern begins with the left shoulder forming at roughly $0.860, followed by a deeper trough—the head—around $0.844. The pattern completes with the right shoulder, identified by a higher low NEAR $0.856. This formation often signals a shift from bearish to bullish momentum.
Source: X
The neckline, acting as a resistance level, is situated at approximately $0.869. A decisive break above this point is likely to trigger a rally, with the measured price target around $0.925 according to the chart projection.
Volume plays a crucial role here: historically, breakouts supported by increased trading volume are more likely to result in sustainable price moves. An uptick in volume as the price approaches and crosses the neckline WOULD validate this bullish pattern.
Recent Price Momentum and Volume Activity
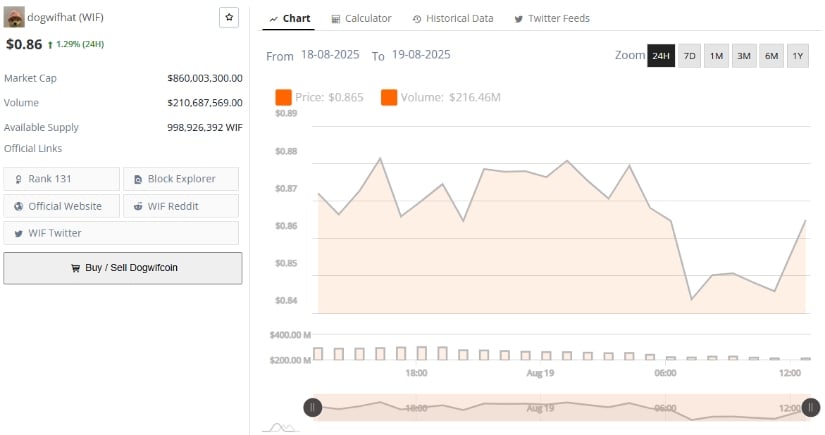
Examining the 24-hour price movement reveals a moderate increase from the lows of $0.860 to a recent high of nearly $0.889. This upward movement is accompanied by rising volume, indicating growing market interest and active buying during the rally.
Resistance is observed at $0.890, a level where the price has seen multiple rejections in recent hours. Meanwhile, $0.860 remains a critical support zone, serving as the base for the inverted head-and-shoulders formation.
Source: BraveNewCoin
Traders will be closely watching these levels: holding above support and breaking resistance could confirm the breakout, while failure might extend consolidation or trigger declines.
The notable volume spikes during price advances reinforce the bullish outlook, suggesting that buyers are increasingly active. Sustained volume alongside upward price action strengthens the probability of a rally toward the $0.925 target.
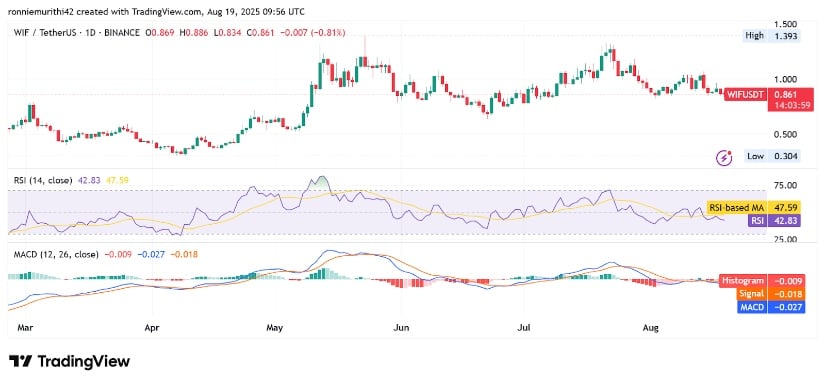
Momentum Indicators Present Mixed but Optimistic Signals
On the daily chart, technical momentum indicators offer additional perspective. The Relative Strength Index (RSI) stands at 42.90, positioned in a neutral zone marginally above oversold levels. This implies that WIF is not currently overextended and may have room to MOVE in either direction depending on market drivers.
Source: TradingView
The MACD shows the MACD line sitting below the signal line, reflecting short-term bearish momentum. However, the recent histogram bars are small, indicating weakening downward pressure. This scenario suggests a potential for momentum to shift if buying pressure intensifies and key resistance levels are overcome.
Together, the RSI and MACD signal cautious optimism. While the market sentiment is mixed, the neutral RSI supports the possibility of an upward move. Confirmation from a MACD crossover and price action breaking resistance levels would be necessary to validate the bullish scenario.
