🚀 Dogwifhat ($WIF) Price Prediction: Ascending Triangle Hints at Explosive Breakout—Traders Watch Key Resistance

Dogwifhat ($WIF) is flirting with a make-or-break moment—and traders are leaning in.
The Setup: An ascending triangle pattern has emerged on $WIF’s chart, a classic bullish signal that often precedes a violent upside move. The catch? It needs to smash through critical resistance first.
The Stakes: If the breakout holds, the memecoin could see parabolic gains. If not? Well, it’s just another crypto promise lost to the charts—right next to those 'sure thing' NFT projects.
Why It Matters: In a market obsessed with narratives, $WIF’s technicals are doing the talking. No vaporware, no roadmap fluff—just pure price action. (And let’s be real, that’s refreshing after the 47th 'institutional adoption' press release this week.)
Watch This: Volume on the breakout. No pump survives thin liquidity.

Traders and investors are closely monitoring price action and volume alongside momentum indicators to anticipate the next significant trend.
Ascending Triangle Formation Reflects Consolidation and Pressure Build-Up
The weekly chart reveals an ascending triangle pattern, characterized by a series of higher lows converging on a horizontal resistance level. This formation indicates accumulation, where buyers are incrementally increasing their positions as the price tests the resistance repeatedly. The resistance acts as a crucial barrier that must be breached to trigger a breakout.
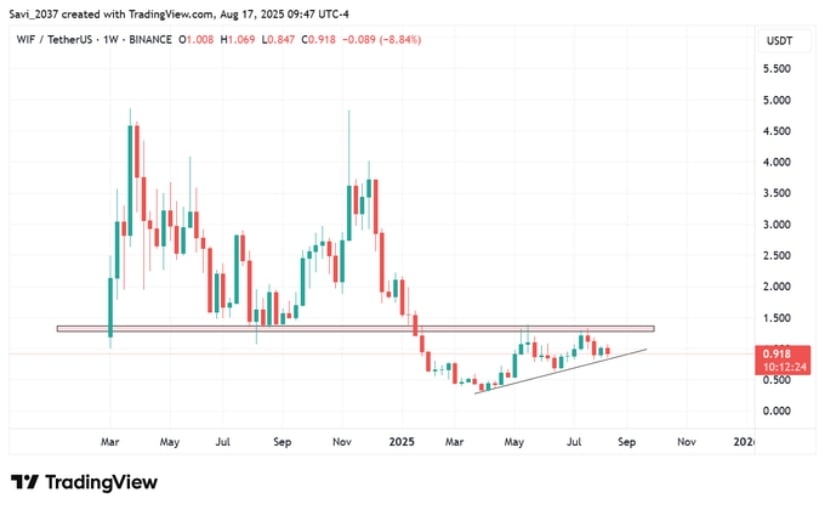
Source: X
Current price action shows $WIF trading just below this resistance, with narrowing price ranges suggesting that the market is gearing up for a decisive move. Should the memecoin break above the resistance line with strong volume, it could initiate a bullish surge consistent with historical patterns of ascending triangles.
However, failure to clear this level might lead to a price reversal or prolonged consolidation, underscoring the importance of this price zone.
Daily Price and Volume Profile Point to Crucial Support Levels
Examining recent daily price movements reveals that the token has found support between $0.86 and $0.87, preventing sharp declines. Trading volume within this range has remained steady and occasionally peaked during tests of the support, suggesting that buyers are active in defending this level.
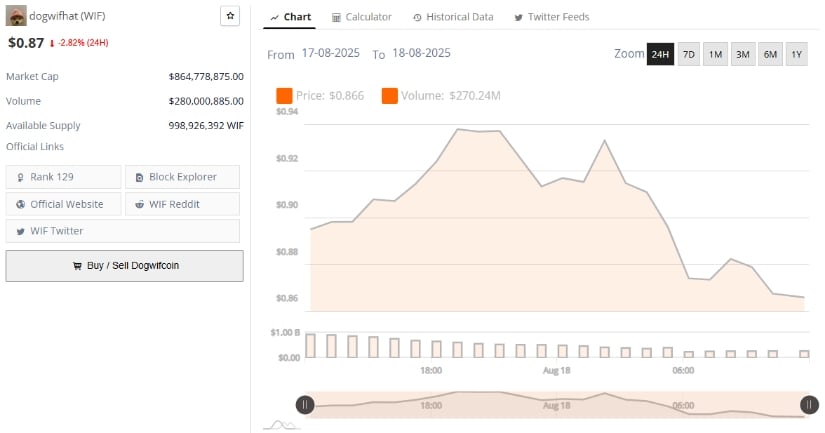
Source: BraveNewCoin
While the support zone remains intact, volume data shows a lack of strong upward momentum yet, as bulls await confirmation before pushing prices higher. This consolidation phase indicates market indecision, with participants assessing whether the token can gain enough traction to challenge the upper resistance.
Traders should watch for an increase in volume correlated with price gains above resistance, which WOULD provide stronger evidence of a breakout.
Momentum Indicators Show Mixed Signals, Calling for Caution
Technical momentum indicators present a nuanced view of $WIF’s short-term potential. The MACD shows a slight bearish bias as the MACD line remains below the signal line, reflected in negative histogram bars. This indicates that momentum is currently weak, cautioning that selling pressure could persist unless a crossover occurs.
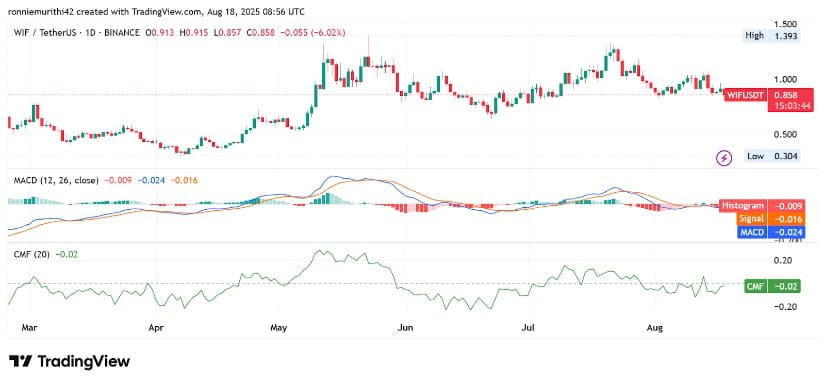
Source: TradingView
On the other hand, the Chaikin Money FLOW (CMF) suggests a mild net inflow of capital with a reading of 0.02. This implies modest buying interest that has not yet translated into strong price momentum. For a sustained rally to develop, increases in CMF coupled with a bullish MACD crossover are required to signal a shift toward stronger buying pressure.
However, current momentum indicators suggest that market sentiment is still tentative, with buyers yet to fully assert control. Traders should closely monitor support levels, volume spikes, and technical signals for confirmation before entering new positions. The coming weeks will be pivotal in determining whether the token can overcome its resistance and begin its anticipated upward trend or face a period of consolidation or decline.
