XLM on the Brink: Bulls Charge as Price Nears Critical $0.4569 Resistance

Stellar (XLM) is flashing breakout signals as it challenges a make-or-break resistance level—traders are watching the $0.4569 line like hawks.
The Setup:
After weeks of consolidation, XLM’s price action is coiled tighter than a Wall Street trader’s stress ball. A decisive close above $0.4569 could trigger a domino effect of buy orders.
Why It Matters:
This isn’t just another resistance test. A breakout here could confirm a bullish reversal pattern, sending XLM into uncharted territory—or, in crypto terms, 'back to where it was before the last crash.'
The Wildcard:
Market sentiment remains split. Bulls point to strong on-chain metrics; bears whisper 'overleveraged' and check their short positions. Either way, volatility’s coming—strap in.

The asset’s consolidation around this crucial threshold signals market anticipation, with a breakout beyond this point potentially catalyzing a strong upward surge.
Symmetrical Triangle and Breakout Potential
The chart shared by EKOANALİZ identifies a narrowing price range within the symmetrical triangle, indicating market indecision before a significant directional move.
The analyst projects that a clean break above $0.4569 could act like a “rocket,” pushing the price toward the next target zone around $0.47 or higher. This resistance level aligns with previous price action highs of XLM, making it a critical hurdle to clear for sustained bullish momentum.
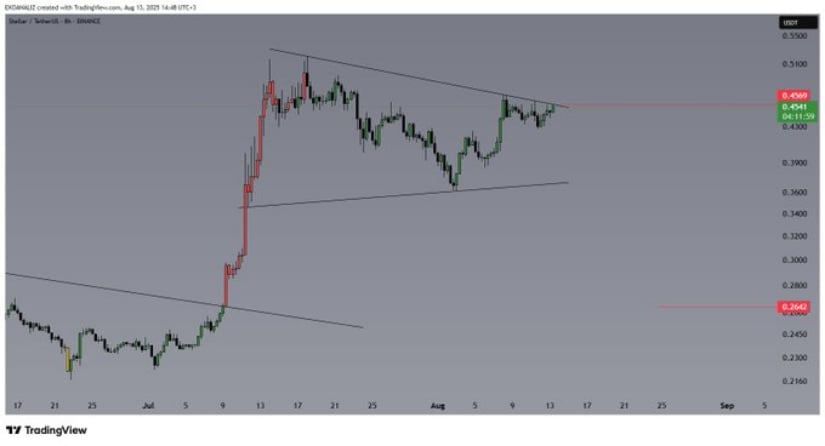
Source: X
On the downside, failure to breach resistance and a drop below the triangle’s lower boundary could trigger a pullback toward $0.44, signaling a potential short-term bearish shift. Such a move WOULD suggest that sellers are gaining ground, possibly prompting consolidation or correction before the next attempt to climb higher.
Market Activity and Volume Insights from Bravenewcoin
Short-term price data exhibits a retracement in the last 24 hours, with XLM price declining by approximately 1.55% to hover near $0.45. Despite the dip, support levels around this range have remained largely intact. Trading volumes remain moderately active with about $646 million exchanged over the past day, reflecting steady market participation and interest.
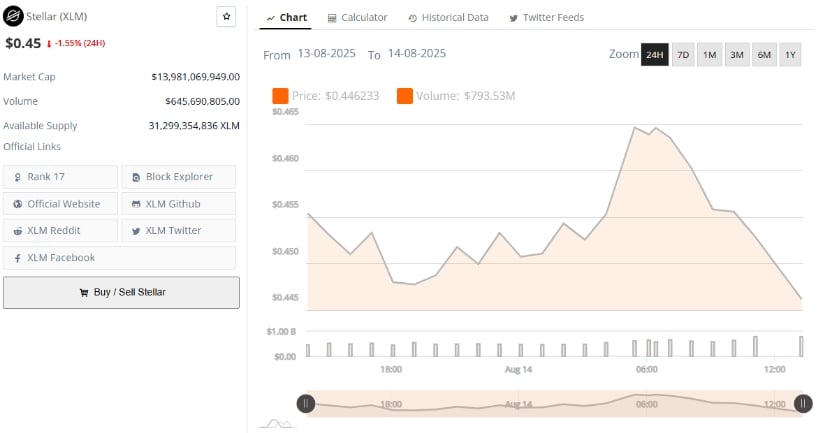
Source: BraveNewCoin
Price fluctuations between $0.45 and $0.46 indicate the presence of resistance NEAR $0.46, matching the analyst’s highlighted breakout level. The recent downward trend suggests some selling pressure, but the resilience of support levels near $0.45 could provide the stability needed for the next upward move.
Volume spikes accompanying price changes hint at volatile market sentiment, emphasizing the importance of this price zone as a battleground between buyers and sellers.
Longer-Term Technical Perspective and Momentum Indicators
Looking at a broader timeframe, XLM has experienced significant movements over recent months, surging close to the $0.52 mark before retracing to its current level near $0.45. The Relative Strength Index (RSI), positioned around 58.35, indicates a neutral stance, neither overbought nor oversold, allowing room for directional shifts in either way.
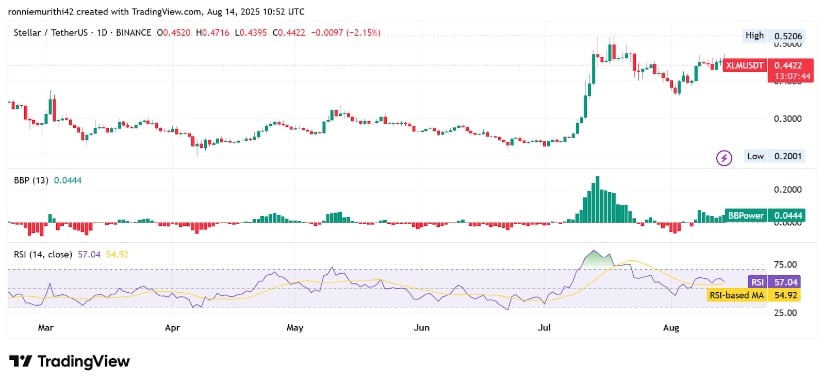
Source: TradingView
Positive buying momentum earlier in the cycle is evident from increasing green volume bars, suggesting that bulls had exerted control before the current consolidation. The Bollinger Band Power indicator signals potential strength continuation if the uptrend resumes. The resistance pivot near $0.46 remains a vital decision point, and surpassing this could propel the price toward further resistance levels near $0.52.
Market watchers should keep a close eye on RSI levels as potential reversal signals could surface if the asset reaches overbought territory. Meanwhile, sustaining above vital support levels around $0.44 to $0.45 is crucial for maintaining bullish potential.
