SEI Price Surge: Breaking Resistance Levels in a High-Stakes Crypto Rally
SEI isn't just knocking on resistance—it's kicking the door down. The altcoin's latest surge has traders scrambling as it carves through key price barriers like a hot knife through butter.
Why this breakout matters
Unlike the usual pump-and-dump schemes flooding crypto Twitter, SEI's move shows actual technical conviction. The asset's trading volume tells the real story—no smoke, just fire.
Wall Street's watching (and sweating)
While traditional finance still dismisses crypto as 'digital Beanie Babies,' assets like SEI keep proving them wrong. Another 20% climb? That'd make more hedge fund managers cry into their overpriced lattes than we'd care to count.

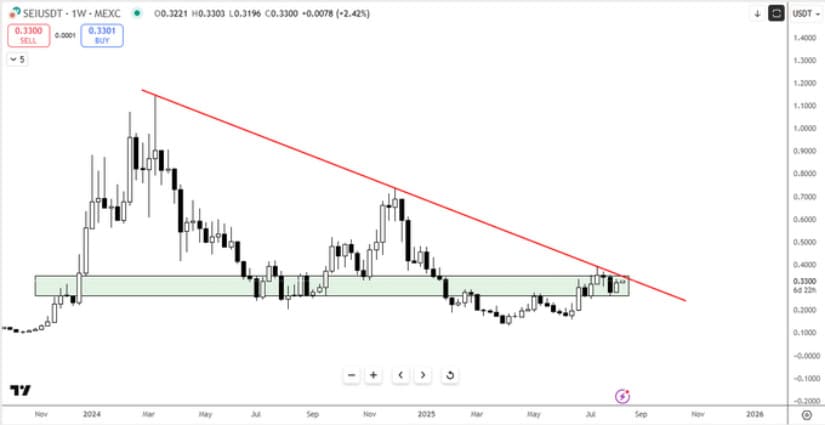
The price nears $0.33, testing the intersection of a descending trendline from late 2023 and a significant horizontal resistance zone. This pivotal moment hints at a potential breakout that traders will watch closely.
SEI Faces Key Resistance Levels Amid Market Shifts
The accompanying weekly SEI/TetherUS (SEIUSDT) chart outlines the technical structure shaping the asset’s price action. Since late 2023, a descending red trendline has acted as an overarching resistance, capping upward momentum.
More recently, the price has rallied to meet this trendline concurrence with a horizontal resistance zone between roughly $0.25 and $0.33. This area has historically functioned as a strong battleground for buyers and sellers, frequently flipping between support and resistance.

Source: X
A successful and sustained break above both the descending trendline and the horizontal zone WOULD signal a decisive technical shift. According to the analyst, the conditions — possibly driven by accumulation or intrinsic market strength — favor SEI overcoming these barriers.
Such a breakout would invalidate the prevailing bearish trend and could unlock a fresh wave of upward momentum. Conversely, failure to surpass this confluence of resistances might force the asset back into its previous trading range, prolonging consolidation and uncertainty.
Market Activity and Price Trend
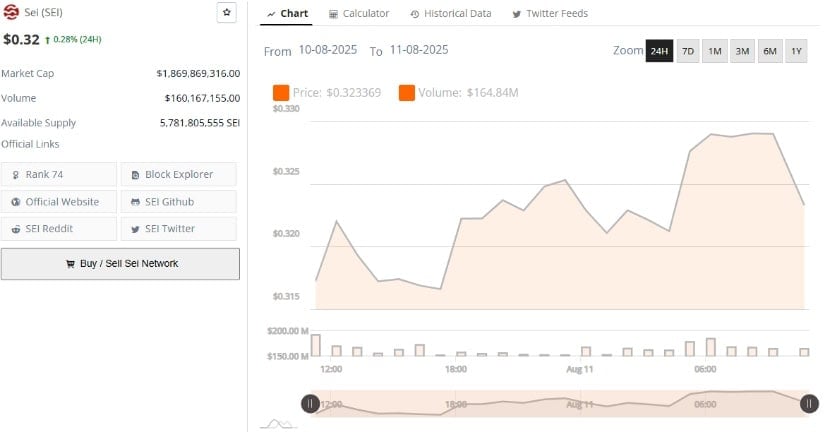
Looking at more immediate market data, BraveNewCoin provides a 24-hour chart indicating SEI trading in a narrow range between approximately $0.315 and $0.327. The price ended the period NEAR $0.32, reflecting a marginal gain of 0.28%. Alongside this, trading volume remains robust, exceeding $160 million over the same span.

Source: BraveNewCoin
A particular volume spike coincided with a brief price dip followed by a recovery, suggesting active demand from buyers at lower price points. This buying pressure helped prevent a deeper decline and effectively formed a support cushion.
Despite the recent sideways movement, the persistent volume and price resilience demonstrate healthy engagement among traders. This dynamic hints that while cautious, the market is primed for a resolution either through a breakout or a renewed consolidation phase.
Indicators from TradingView Suggest Cautious Optimism
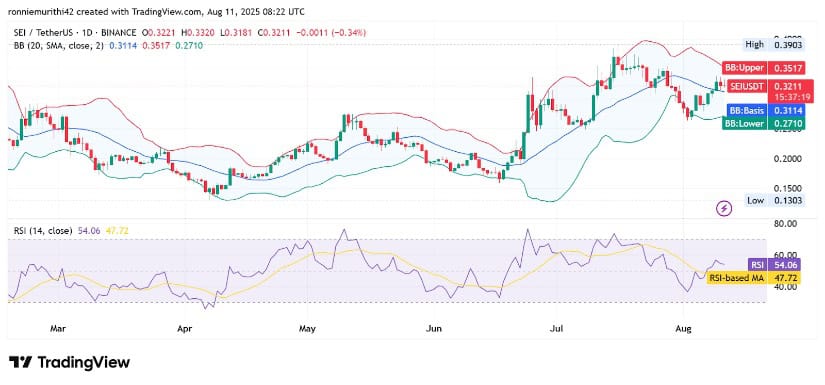
At the time of writing, TradingView shows SEI trading at around $0.3235, up by 0.40% on the day. The daily chart presents encouraging signs for bulls as SEI has breached the mid-Bollinger Band after a correction from the upper band. Typically, moving above the mid-Bollinger Band signals a potential shift from bearish to bullish momentum.

Source: TradingView
Supporting this, the Relative Strength Index (RSI) is at 54.85, comfortably above the neutral midpoint of 50, and has crossed above its 47.77 moving average. This crossover reinforces the case for an ongoing recovery, suggesting increasing buying interest and improving sentiment.
Should Sei hold above the mid-Bollinger Band, it has the potential to target previous highs near the upper Bollinger Band. However, failure to maintain this support level could see the price revisit recent lows, reflecting ongoing market caution.

