SEI Surges Toward $0.54 as SuperTrend Flips Green – Bulls Take Control

Another day, another crypto breakout—but this one’s got teeth. SEI’s price just got a turbocharge as the SuperTrend indicator flips bullish, painting a target squarely at $0.54. Forget ‘slow and steady’—this is crypto’s version of a drag race.
SuperTrend Flips, Charts Scream ‘Buy’
The algorithm’s bullish reversal isn’t just a blip. It’s the kind of signal traders salivate over—especially after weeks of sideways action. Suddenly, SEI’s not just another altcoin; it’s the one flashing green on every scanner.
Target Locked: $0.54 or Bust
No vague moon promises here. That $0.54 target? It’s technical, it’s testable, and—if history repeats—it’s where the first wave of profit-takers will cash out. (Cue the ‘diamond hands’ crowd groaning.)
Of course, in crypto-land, even ‘sure things’ love to fake out. If SEI stumbles here, the same chartists hyping it today will be the ones whispering ‘dead cat bounce’ tomorrow. Such is life when your market runs on hopium and caffeine.

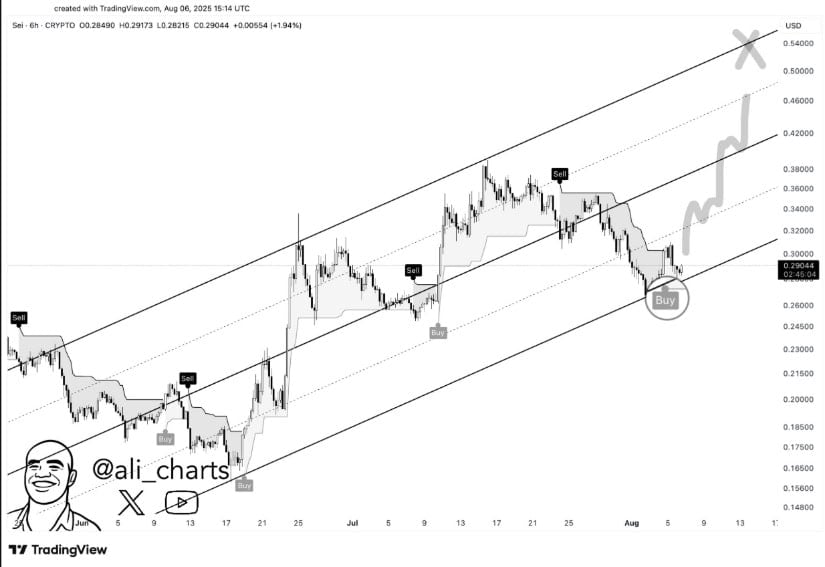
This setup suggests a potential reversal or upward movement, making it an ideal entry point for traders.
As the altcoin hovers NEAR $0.29, analysts are watching closely for a move toward the $0.54 level, aligning with historical patterns of substantial gains. However, caution is needed as a potential Head and Shoulders (H&S) pattern may signal bearish pressure unless the price breaks the key $0.3400 resistance..
SEI Price Analysis: Bullish Setup with Potential Growth
The chart analysis from analyst Ali reveals a promising technical setup for Sei. A bullish signal has emerged, indicated by the SuperTrend indicator, which has flipped to bullish after a period of consolidation. The current price stands at $0.29, with the asset positioned near the bottom of an ascending channel.
Source: x
Given the historical trends observed in similar setups, the token could experience significant upward momentum in the near future. Analysts are targeting the upper boundary of the ascending channel, which could potentially push the price to the $0.54 level.
The bullish sentiment is reinforced by the chart’s alignment with historical price action, where similar patterns have led to notable gains. The market conditions are supportive of a breakout, suggesting a favorable scenario for traders looking to capitalize on an upward move.
Resistance Level to Watch: $0.3400
A crucial resistance level for SEI is identified at $0.3400. For the bullish trend to maintain its momentum, the price must break and close above this level on a daily basis. The resistance at $0.3400 has proven to be a significant barrier for the price action. If the bulls fail to push above this level, the market may experience a bearish reversal.
Currently, the price is hovering around the $0.29 mark, and any sustained movement above $0.34 could confirm the continuation of the upward trend. The market has witnessed volatility in the last 24 hours, with the price peaking at $0.2917 before declining slightly, indicating some consolidation in the short term. The focus remains on how the price interacts with the $0.3400 resistance, which will provide further clues on the next directional move.

Source:BraveNewCoin
Head and Shoulders (H&S) Pattern: A Bearish Threat
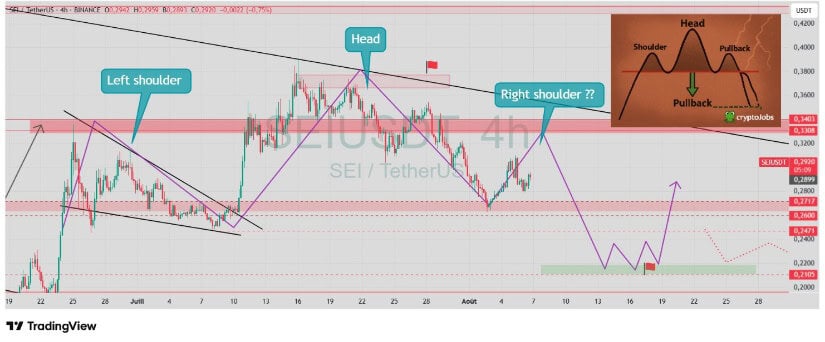
The chart analysis by CryptoJobs3 indicates a potential Head and Shoulders (H&S) pattern forming on the 4-hour timeframe. The left shoulder and head have already been established, with the right shoulder still in question. If the price continues its downward trajectory and breaks below the critical support levels, this pattern could confirm a bearish reversal, signaling further downside potential.
Source:X
Should the market confirm the H&S pattern, the downside movement could lead to a retest of lower support levels, including the $0.28 zone. This WOULD suggest a potential pullback in the price, which could disrupt the current bullish outlook.
Traders should remain cautious of this pattern and consider the possibility of further downside movement unless the price action shows signs of a reversal. The development of the right shoulder will be an important factor to monitor in the coming days.
Volume Activity and Short-Term Market Sentiment
The trading volume for the crypto has been relatively high, reaching approximately $121.68 million during the last 24 hours. This suggests substantial market activity, but the fluctuations in volume closely follow the price movements, indicating a market in transition. The current volume activity reinforces the idea that SEI is undergoing a period of consolidation after an initial rally, with investors uncertain about the next major price move.
The support level at $0.28 appears to be holding firm, as the price has stabilized just above this range. This level is critical for the short-term outlook, as any breach below it could signal a breakdown and a shift toward the bearish scenario. Conversely, if the price continues to maintain support at $0.28 and breaks through the resistance at $0.3400, traders may see a resumption of the bullish trend.
