Cardano’s ADA Primed for Q4 Surge: Technicals & Seasonal Trends Signal Explosive Breakout

Cardano's ADA is flashing bullish signals as Q4 approaches—and this time, the stars might actually align.
Technical setup screams breakout
The charts don't lie: ADA's consolidation pattern mirrors previous pre-bull run behavior. MACD histogram flips green while RSI coils like a spring. Textbook accumulation phase—if you believe in that sort of thing.
Seasonal winds at its back
September historically crushes crypto valuations. But ADA tends to buck the trend, posting average 18% gains in Q4 over the past three cycles. This year? Institutional inflows into staking pools suggest amplified momentum.
Just don't tell the 'efficient market hypothesis' crowd—they're still recovering from their 17th consecutive 'this time it's different' prediction.

After holding steady through a choppy mid-year stretch, Cardano is starting to flash signs of life just as Q4 approaches. A mix of historical seasonality, technical alignment, and bullish sentiment is building in the background.
Cardano Seasonal Trend Suggests Q4 Strength
TapTools brings back a familiar but often overlooked pattern, Cardano’s seasonal performance. Both 2023 and 2024 posted notable Q4 gains, and 2025 appears to be following that same trajectory. The seasonal overlay in the chart makes the case visually clear: each year, ADA has bottomed or consolidated through mid-year only to rally sharply heading into the final quarter.

Cardano’s seasonal chart highlights consistent Q4 rallies over the past two years, with 2025 showing a similar setup. Source: TapTools via X
This pattern isn’t just a coincidence; it’s often tied to macro tailwinds and market cycles. With ADA currently mirroring its previous paths, momentum may start building through August and September.
Cardano Technicals Align With Historical Trend
Building on the seasonal pattern highlighted earlier, the latest image from TapTools shows that Cardano’s technical setup is now echoing optimism. Weekly and monthly indicators are flashing a strong consensus: ADA is in a buy zone. Momentum tools like MACD, RSI, and the Stochastic Oscillator all lean bullish, while 12 of 13 moving averages support continuation to the upside. This kind of alignment across multiple timeframes creating a favorable atmosphere for the bulls.

Cardano’s multi-timeframe indicators flash bullish, with 12 of 13 moving averages and key momentum tools signaling strong upside potential. Source: TapTools via X
Cardano Price Setup Eyes Breakout Zone Around $0.84
Riding the back of strong seasonal and technical alignment, Ali Martinez chart adds a clearer structure to Cardano’s potential breakout path. The descending channel has kept ADA capped for days, but price action is now pressing up against a critical resistance trendline NEAR $0.84. A confirmed breakout here could open the gates toward $1.00 and potentially $1.30 if momentum holds.

Cardano is testing a key resistance near $0.84, with a breakout potentially unlocking targets toward $1.00 and $1.30. Source: Ali Martinez via X
What makes this setup especially compelling is how it fits within the broader narrative. The Q4 seasonal trend is supportive, technical indicators are favoring bulls, and now the price is closing in on a chart-defined trigger level. That confluence raises the stakes, not for hype, but for an actual technical move.
Cardano Price Prediction: Retest Validates Higher Time-Frame Breakout Structure
This latest zoomed-in 3D chart from CryptoBullet shows ADA cleanly breaking out from a long-standing descending triangle, followed by a textbook retest. That retest around the $0.72 region is key here. Instead of falling back into the range, cardano held the breakout line and bounced, suggesting the move isn’t just noise but potentially the real beginning of a trend shift. The 200-day moving average below is also sloping up and aligning with the breakout zone, adding technical weight to the setup.
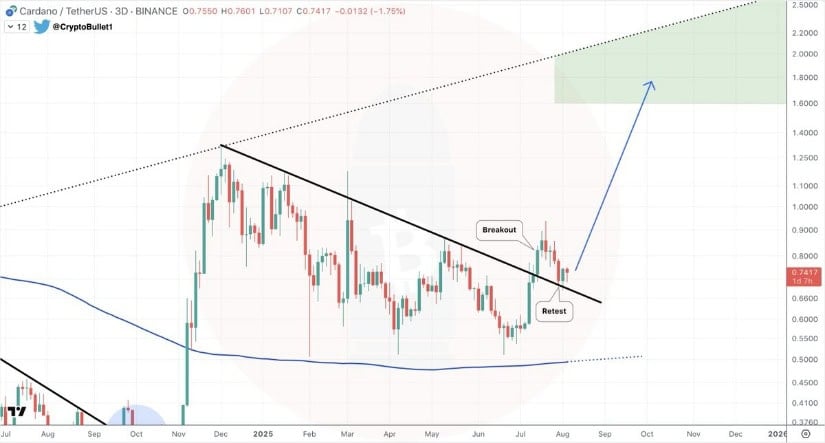
Cardano holds its breakout above $0.72 with a successful retest. Source: CryptoBullet via X
ADA now has a clean technical breakout retest structure. This gives Cardano price prediction room to stretch towards the $1.60 to $1.85 zone, with momentum building quietly behind the scenes.
ADABTC Cycle Mirror Sparks Interest
Polaris’s ADA/BTC comparison adds another LAYER to the unfolding Cardano narrative. The chart draws a compelling parallel between the 2021 and 2025 ADA/BTC structures, with both showing prolonged accumulation followed by an upward spike. If the pattern repeats, a higher low could be forming now, setting the stage for a Q4 rotation that aligns with the seasonal and USD-based setups.

ADA/BTC chart shows a striking resemblance to 2021’s cycle. Source: Polaris via X
Final Thoughts: Will Cardano Ride the Q4 Wave Again?
Cardano’s setup heading into Q4 looks stronger than usual with seasonal tailwinds, breakout-level price action, and bullish technicals all pointing in the same direction. The $0.84 level remains the immediate hurdle, but if ADA can clear it with volume, the path towards $1.00 and beyond opens up quickly.
