SEI Primed for Explosive Move: $0.283 Support Floor Holds Strong

SEI isn't asking permission—it's carving its own path. The token's price action coils like a spring above the $0.283 support level, teasing a breakout that could send traders scrambling.
The Line in the Sand
That $0.283 isn't just a number—it's the battleground where bulls and bears throw down. Three retests this week? All held. No flukes, no fakeouts. The market's voting with its wallet.
The Setup
Volume's creeping up like a silent assassin. MACD's flirting with a bullish crossover. And those leverage traders? They're already positioning like this is the next 'sure thing'—because what's crypto without a little reckless optimism?
The Punchline
Either SEI shatters resistance and moonwalks toward its next liquidity pool, or it becomes another 'almost' story in the graveyard of altcoin dreams. Place your bets—Wall Street's watching with popcorn, waiting to see if retail nails it or gets nailed again.

However, key support at $0.283 remains intact, which could allow the price to rebound if this level continues to hold. A breakthrough above resistance at $0.310 could pave the way for higher targets, including $0.319, $0.350, and $0.389, depending on market conditions.
SEI Price Action and Key Support Level
The price chart for SEI shows the asset’s recent volatility following a network upgrade, which resulted in price movements within a tight range. After reaching a peak NEAR $0.3100, the token failed to maintain that level and has since retreated to $0.2886, reflecting a notable decline.
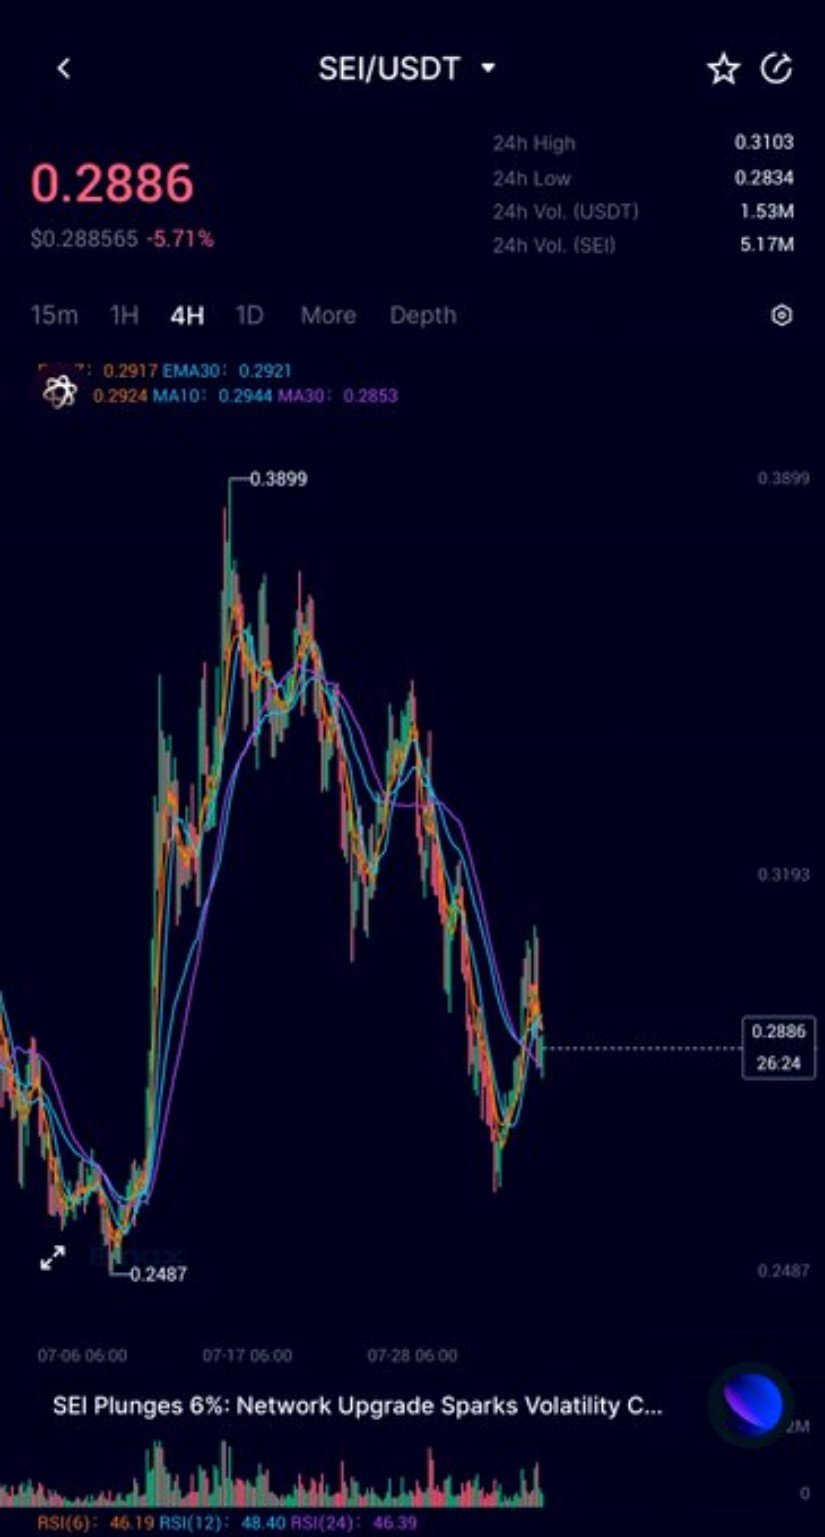
Source: X
The asset has held a firm support zone around $0.283, which has acted as a rebound point in recent sessions. If the price remains above this support, there could be potential for a bullish breakout, pushing the price higher toward the upper resistance zones.
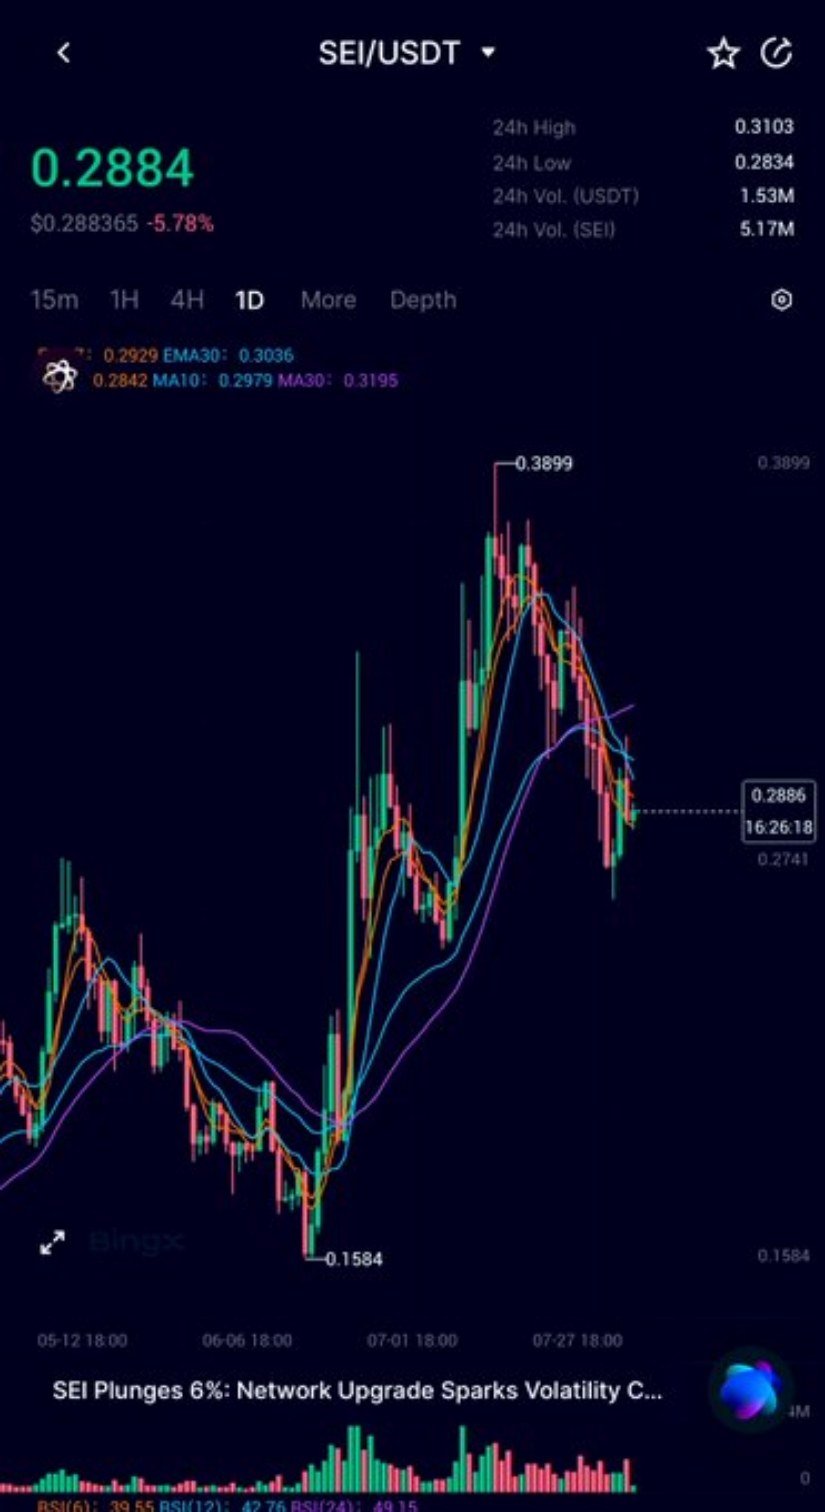
Source: X
The price action is currently testing this support zone, and a bounce could trigger an attempt to break past the $0.310 resistance. Technical indicators support the notion that, if the price holds above $0.283, it might target higher levels.
However, the ability to break the $0.310 resistance is critical for a full-scale reversal, and failure to do so may lead to further consolidation or a potential breakdown towards lower support.
Bearish Indicators and Potential for Downside
While Sei Price demonstrated resilience at its support levels, key technical indicators suggest a potential downside. The Moving Average Convergence Divergence (MACD) indicator suggests weakening momentum, as the histogram has moved into negative territory.
The MACD line, positioned below the signal line, reflects bearish pressure and further reinforces the current downtrend. These signals indicate that sellers remain in control, and a continued downward movement remains possible if the support level at $0.283 fails to hold.
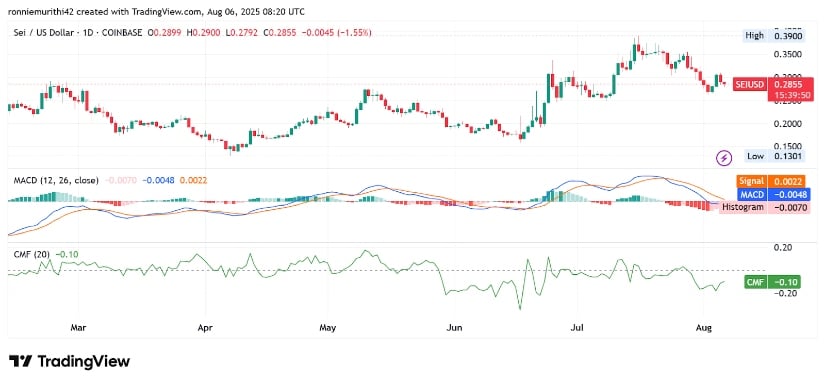
Source: TradingView
The Chaikin Money FLOW (CMF) indicator adds further caution, with a reading of -0.10 indicating negative money flow. This suggests that selling pressure has dominated the market recently, keeping institutional investors hesitant.
Although there has been a slight uptick in CMF since mid-July, it remains in negative territory, highlighting a lack of confidence among larger market participants. Without a reversal in the CMF or a shift in market sentiment, the token may continue to face downward pressure, with the next support zone around $0.260.
Trading Volume and Market Sentiment
Additionally, volume analysis shows increased trading activity during price dips, signaling that market participants are seeking better entry points. The recent volume surge during price peaks suggests that there has been considerable market interest, although this has not been enough to sustain the rallies.
The drop in volume during subsequent pullbacks hints at the market’s indecisiveness and weak bullish support, suggesting a cautious market outlook.
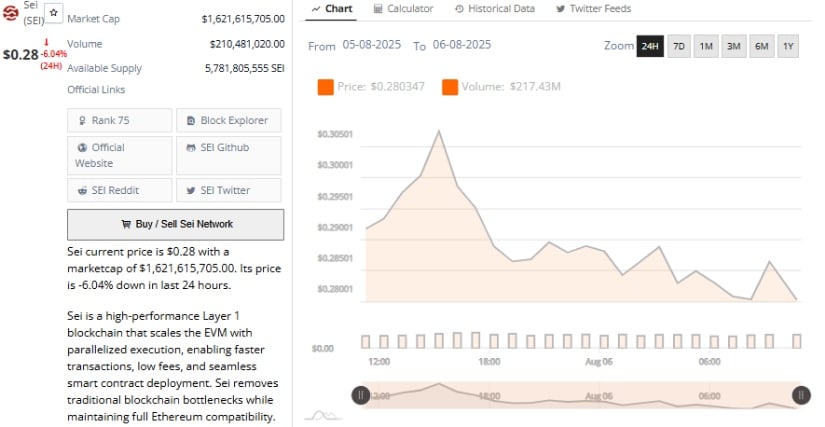
Source: BraveNewCoin
For SEI price to break its current consolidation phase, volume needs to increase as the price tests the resistance levels. A breakout above $0.310, coupled with strong volume, could indicate the start of a new bullish trend. Traders should monitor the volume and support levels closely, as any shift in either factor could lead to a change in the overall market sentiment.
If the altcoin price continues to hold above the $0.283 support level and shows signs of upward movement, a breakout may be on the horizon. However, without confirmation from volume and momentum indicators, the bearish pressure might persist.
