Floki Defies Gravity: Key Support Holds Firm, Signaling Second Super Cycle Ahead

Memecoin madness isn't dead—it's reloading. Floki's price action just flashed a bullish divergence that'd make even Wall Street's most jaded chartists raise an eyebrow.
The dog-themed token—yes, the one named after Elon Musk's Shiba Inu—is painting a textbook retest of its breakout level. No fancy indicators needed here: the market's screaming 'accumulation' in neon letters.
Meanwhile, 'serious' investors keep pouring billions into private equity funds charging 2-and-20 for sub-bond returns. But hey, at least those prospectuses look fancy framed in mahogany offices.
Next resistance? Let's just say the last 30 days' volume suggests this meme has more legs than a Dogecoin conference afterparty.

While momentum indicators remain mixed, the token continues to trade within a key ascending channel that has historically preceded strong breakouts. Analysts are now watching closely to determine whether price action confirms this bullish setup.
Super Cycle Structure and Channel Pattern Support Outlook
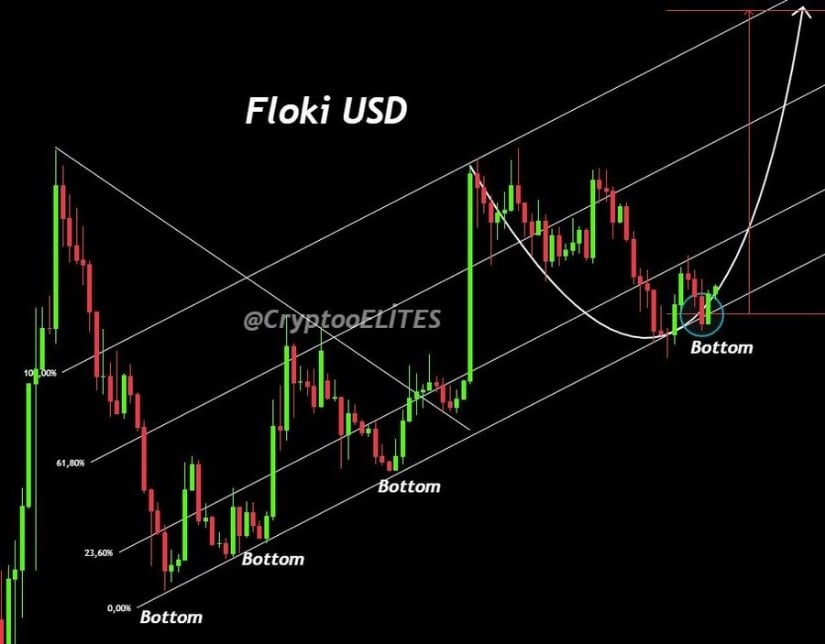
According to technical analysis from Alpha Drop (@airdropalpha40), FLOKI/USD is showing a pattern consistent with the early stages of a second super cycle.
The chart identifies a rising parallel channel supported by Fibonacci levels, with each touch at the lower boundary resulting in upward price movement. The current price action again aligns with the lower support zone, suggesting the potential for a rebound in line with prior trend behavior.
Source: X
A rounded bottom structure has also emerged on the chart, often interpreted as a base-forming signal. This formation indicates that selling pressure may be waning and a shift toward accumulation is underway. FLOKI is currently hovering near the midline of the ascending channel and testing overhead resistance. A successful breakout above this midpoint could open the door for continuation toward the upper boundary, maintaining the super cycle projection.
A vertical arrow drawn in the top-right quadrant of the analyst’s chart signals an upside target aligned with the channel’s top band. This visualization assumes a breakout from the neckline WOULD catalyze the next leg upward. If confirmed by volume and sustained price movement, FLOKI could revisit previous local highs or form new ones. The technical structure remains valid as long as the price holds above the lower support line of the rising channel.
Short-Term Volatility and Volume Dynamics Remain Elevated
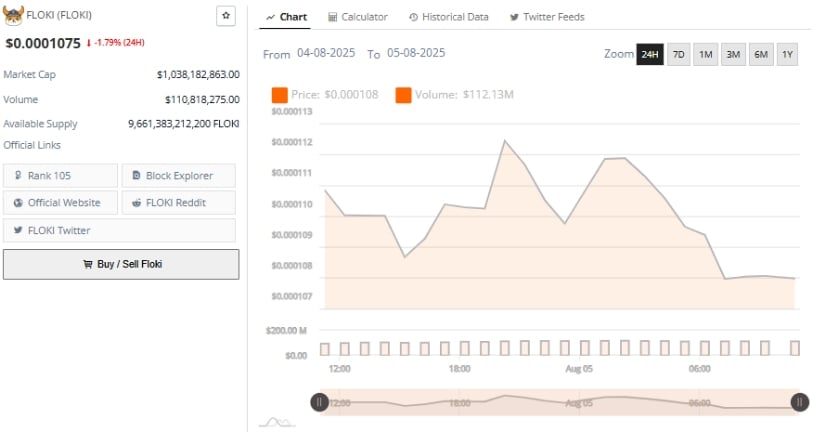
The 24-hour price chart for FLOKI shows pronounced intraday volatility. The token opened the session NEAR $0.0001108 and experienced a brief dip, followed by two recovery attempts that failed to sustain momentum. Both upward movements were met with immediate resistance and faded quickly, leading the token to settle around $0.0001075 by the session’s end. This marked a 1.79% decline for the day, consistent with short-term bearish sentiment.
Source: BraveNewCoin
Trading volume remained active, reaching $112.13 million. The increased activity during price peaks suggests that short-term traders sold into strength. This intraday “pump and fade” behavior indicates a lack of follow-through from buyers. As the session progressed, volume tapered alongside price, suggesting temporary exhaustion or indecision in the market. The price now consolidates within a narrow range, pending clearer signals of a return to momentum.
FLOKI’s current market capitalization stands at $1.038 billion, ranking it 105th among digital assets by size. Its circulating supply of over 9.66 trillion tokens makes the asset highly responsive to volume-driven moves. The failure to reclaim and hold levels above $0.0001110 increases the likelihood of further support testing unless broader sentiment shifts upward.
Momentum Indicators Signal Short-Term Weakness
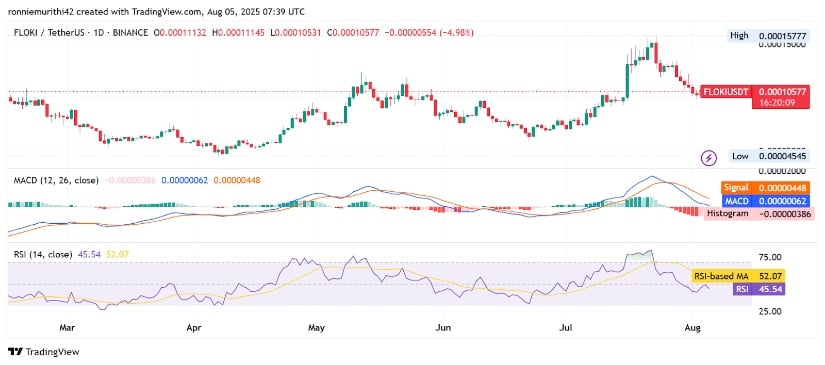
At the time of writing, FLOKI/USDT is trading around $0.00010681, registering a 4.04% daily decline.
The token has retraced from a recent local high of $0.00015777 and is now testing support between $0.000105 and $0.000100. This zone has acted as a pivot during prior corrections, making it a crucial area for potential stabilization.
Source: TradingView
The MACD indicator has turned negative, with the MACD line crossing below the signal line and histogram values also moving into red territory. This crossover suggests weakening bullish momentum, leaving the trend vulnerable unless a reversal develops.
Meanwhile, the RSI stands at 46.21, which is below its 52.12 moving average. This indicates mid-range weakness, with price not yet in oversold territory but trending downward. Traders may await RSI confirmation and MACD stabilization before expecting a broader recovery.
