Solana Breaks Out: Whale Activity and Triangle Pattern Propel SOL Toward $300

Solana's price action just got interesting—again. A textbook triangle breakout combines with surging whale transactions to fuel bullish momentum. Here's why traders are betting on a run to $300.
Technical Tailwinds
The symmetrical triangle breakout—confirmed on higher-than-average volume—suggests SOL's consolidation phase is over. Chartists see a measured move target aligning perfectly with that psychological $300 level.
Whales Make Their Move
On-chain data reveals seven-figure SOL purchases hitting the books this week. When these deep-pocketed traders accumulate, retail usually follows—whether that ends well or not.
Macro Meets Crypto
With traditional markets pricing in rate cuts (finally), altcoins like SOL often outperform. Just don't tell the SEC we're using their monetary policy as a trading signal.
Prediction: SOL either hits $300 by September or we all pretend this analysis never happened. Welcome to crypto.

Solana is quietly building momentum while the rest of the market stalls. Despite a choppy macro environment and fading hype in other altcoins, solana just hit a major milestone on the on-chain front.
At the same time, technicals are lining up in Solana’s favor. A steady trend of higher lows, a textbook ascending triangle NEAR major resistance, and nearly $52 million in liquidation pressure stacked around $188 all suggest a possible sustainable upside.
Solana’s On-Chain Dominance Could Positively Impact Price Action
Solana just clocked its highest-ever true transactions per second (TPS), averaging 1,318 in July, a number that sets a new standard not only for the network but for LAYER 1 performance across the board. According to SolanaFloor, these are non-voted transaction metrics, meaning they reflect actual user activity.

Solana hits a record 1,318 true TPS in July, setting a new benchmark for Layer 1 network performance. Source: SolanaFloor via X
Transaction activity has been rising steadily for months, pointing to sustained adoption rather than short-term noise. If this level of throughput persists, Solana will start to see a positive impact on its price action as well. For now, the chain fundamentals are quietly setting the stage.
Solana Price Structure Shows Strength Above Key Support Levels
Solana continues to trend higher, defying broader market weakness, with a quiet but consistent pattern of higher lows. The latest chart shared by CryptoJelleNL highlights how SOL has reclaimed previous resistance zones and is now converting them into support, particularly the $140 to $150 region.
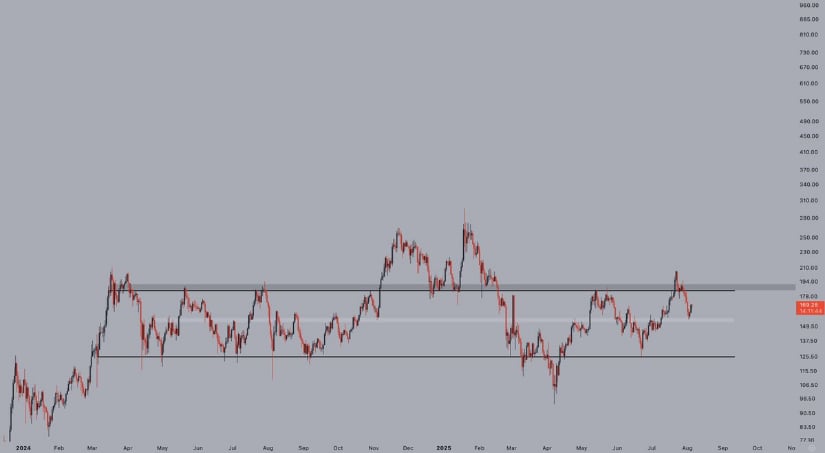
Solana reclaims key support at $140–$150, forming a bullish stair-step pattern with eyes set on the $200 breakout zone. Source: CryptoJelleNL via X
Structurally, this kind of stair-step formation often precedes larger breakouts, especially when it holds firm over multiple tests.
As Solana’s on-chain throughput hits record highs, the technicals now appear to be aligning with the fundamentals. A return above the $200 level could confirm a breakout from this extended range, potentially setting the stage for a run toward new all-time highs within the quarter.
Whale Activity on Solana Reinforces Bullish On-Chain Narrative
The growing conviction in Solana isn’t just technical or on-chain, it’s also being echoed by smart money. As seen in the latest screenshot from TedPillows, a whale just moved $12 million worth of SOL from Binance to Kamino Finance, likely for staking.

A whale transfers $12M in SOL from Binance to Kamino Finance. Source: TedPillows via X
It’s a strong vote of confidence in Solana’s DeFi ecosystem at a time when transaction throughput is at an all-time high and the price structure remains technically sound. When major wallets make accumulation moves during dips, it’s often a signal that broader market participants are still underpricing the long-term potential.
Solana Liquidation Heatmap Highlights $188 as Key Magnet Zone
The latest heatmap data from 5.0Trading reveals a dense liquidation cluster forming near the $188 level, with nearly $51.8M in open interest stacked at that price. This aligns well with Solana’s ongoing bullish structure and increasing whale activity. After holding the $140–$150 support and climbing steadily, this kind of liquidity overhead may act like a magnet if momentum continues building.

Solana’s liquidation heatmap shows $51.8M in open interest near $188, marking it as a key upside magnet. Source: 5.0Trading via X
Solana Price Prediction: Ascending Triangle Formation Signals Mid-Term Upside
Daniel Ramsey’s chart highlights a textbook ascending triangle pattern forming beneath Solana’s $185 to $210 resistance band. The structure shows consistent higher lows pressing against a relatively flat resistance ceiling, an encouraging sign of sustained buying pressure. With SOL holding above its multi-month trendline and consolidating near the breakout zone, this setup often precedes significant upward moves once a breakout confirmation is received.
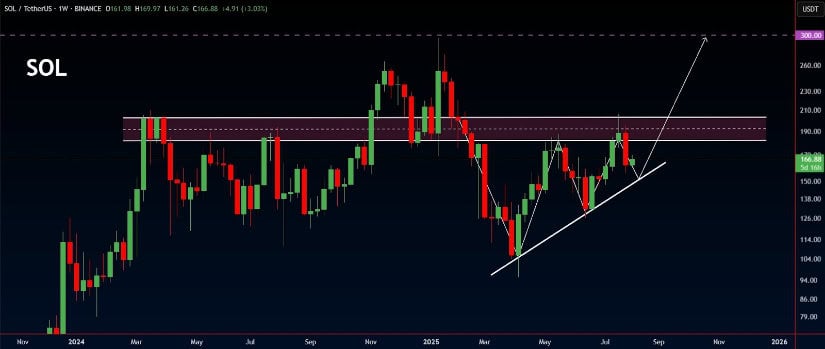
Solana forms an ascending triangle below $210, with bullish structure pointing to a potential breakout toward $280–$300. Source: Daniel Ramsey via X
From a broader perspective, this pattern supports the growing bullish case for Solana. With liquidation heatmaps showing a $51.8M cluster near $188 and fundamentals improving by the week, the technical groundwork for a breakout is strengthening. If this ascending triangle resolves as expected, the next solana price prediction points toward the $280 to $300 region, in line with mid-term pattern targets.
Final Thoughts: Can Solana Break the Range and Aim Higher?
Solana’s price structure, on-chain performance, and whale behavior are starting to align in a way we haven’t seen since the last major run. With a clean ascending triangle forming near resistance, record-breaking TPS numbers, and $12M worth of accumulation from whales, all eyes are now on whether SOL can finally push past the $200 barrier. If that level flips into support, the roadmap toward $280 to $300 becomes more than just speculation; it becomes a technically supported probability.
