🚀 Optimism Price Prediction: Breaking the Downtrend Could Propel OP to $1.20 in Bullish Surge

Optimism (OP) just sliced through resistance like a hot knife through butter—and traders are eyeing a 30% rally.
Breakout or fakeout? The chart doesn’t lie. OP’s decisive close above its 6-month downtrend line signals the bears are losing grip. Next stop: $1.20 if buyers keep their foot on the gas.
Volume tells the tale. The breakout came with above-average trading activity—no ‘ghost rally’ here. Market makers might grumble, but retail’s stacking OP like it’s 2021 again.
Short squeeze loading? With funding rates still negative, a violent move up could liquidate overleveraged bears. Just don’t tell the ‘efficient markets’ academics—they’re still writing papers about last cycle’s memecoins.
Bottom line: Technicals favor the bulls, but watch Bitcoin’s moves. If BTC stalls, even the best altchart won’t save OP from getting dragged down. Welcome to crypto—where ‘macro’ is just an excuse for bagholders.

After months of lower highs, the OP/USDT chart signaled a reversal with a clean push above $0.70. Volume and structure both reinforce the bullish thesis, but short-term signals remain mixed. At the time of writing, technical indicators hint at cooling momentum as price tests support.
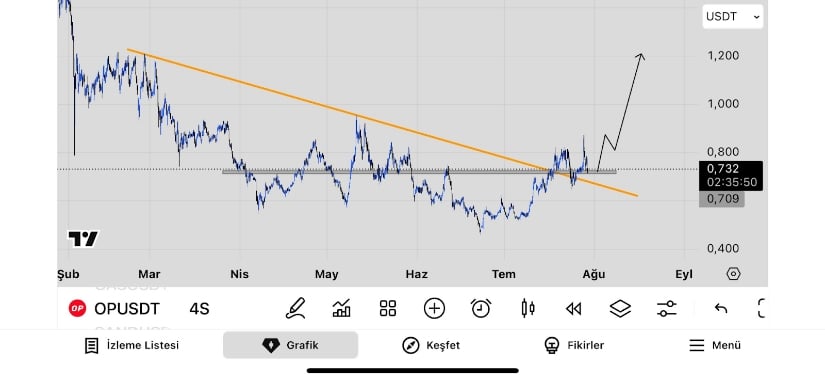
Breakout Reversal Reshapes Medium-Term Structure
The 4-hour OPUSDT chart shows that the price has broken above a descending trendline that extended from February through July. This resistance had consistently capped upside attempts, but the recent surge pushed OP over the $0.70 mark and confirmed the MOVE with a retest.
The breakout formed just above a grey support zone, suggesting the trendline is now acting as a support floor. Volume also picked up during the breakout, confirming trader interest at that level.
Source: X
The accumulation zone between $0.70 and $0.73 plays a central role in the current setup. The price consolidations seen from May to mid-July created a horizontal base, providing structural strength beneath the current trend.
Analysts such as @BTC_USDT_LTC suggest that as long as this area holds, OP could be primed for an advance toward the $1.00 to $1.20 range. Past price reactions around these levels in April give technical weight to this target. A two-phase rally is anticipated—one initial leg upward, followed by a pause, then a second breakout phase.
Downtrend Pressure Returns on Lower Timeframes
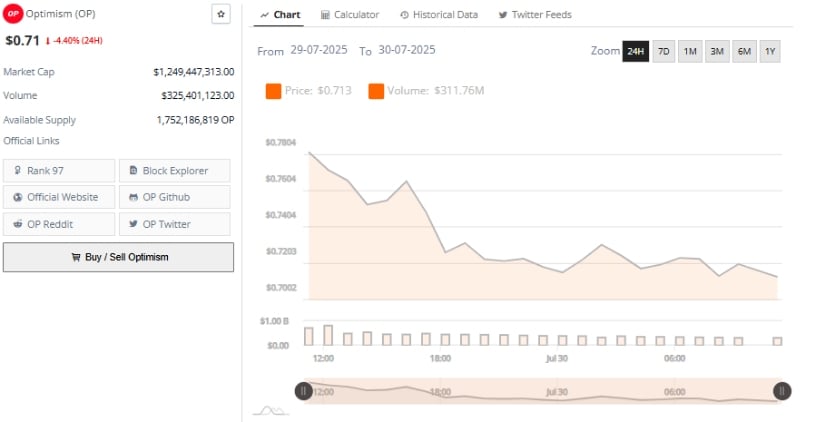
Despite the bullish breakout on the 4-hour chart, the 24-hour performance has shown renewed weakness. OP is down by 4.40% over the past day, dropping from a peak of $0.78 to $0.71. Attempts to reclaim higher ground during the day were short-lived, with quick rejections capping upside momentum. This pattern suggests sellers continue to dominate over intraday sessions, which may create friction for a sustained upward move.
Source: BraveNewCoin
Volume over the 24-hour period reached $311.76 million, but failed to arrest the decline. The distribution of volume appears steady, lacking sharp spikes that WOULD indicate fear-driven selling. Instead, it reflects a controlled but persistent downtrend. With OP’s market capitalization still above $1.24 billion and its ranking at 97, investor interest remains intact, but sentiment could waver if the price does not stabilize soon. Support at $0.68 may be tested again if $0.73 is breached.
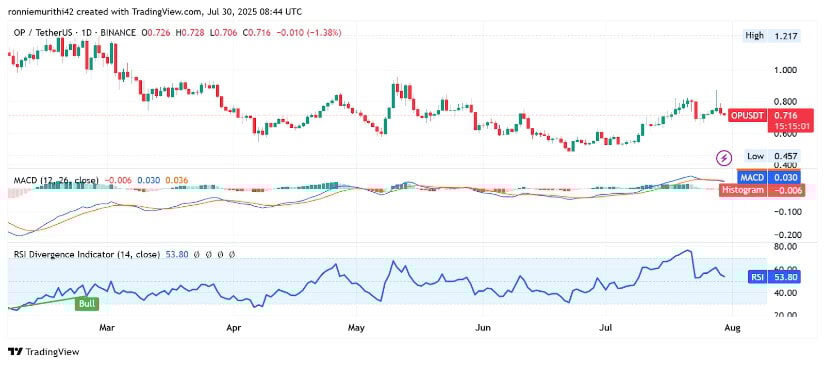
At the Time of Writing, Indicators Show Mixed Momentum
The daily chart reveals that OP recently rejected the $0.80 level, returning to a close of $0.711. This rejection followed an uptrend from mid-June, characterized by higher lows and rising support levels. However, the inability to hold above the key resistance resulted in bearish candlestick formations with long upper wicks. Should pressure continue, support zones NEAR $0.65 or even $0.60 may be revisited.
Source: TradingView
MACD signals are beginning to weaken. Although the MACD line remains above the signal line, the histogram has turned negative at -0.006, hinting at declining bullish momentum. Reduced volume in recent sessions adds to this caution, suggesting a slowdown in buying strength. Meanwhile, the Relative Strength Index (RSI) hovers at 52.96—close to neutral. While not overbought or oversold, the RSI has flattened, implying consolidation could follow.
For Optimism to resume its upward trajectory, the price must hold above the $0.70–$0.73 support band. A move above $0.74 with increasing volume could shift the narrative back in favor of bulls. Until then, mixed signals and short-term rejections indicate a cautious environment, where momentum must rebuild before OP can challenge the $1.20 target.
