Chainlink Eyes $21.71 Target After Defying Gravity at $18 Support

Chainlink bulls just pulled off a textbook bounce—now they're gunning for the next big level.
After flirting with disaster at $18, LINK's rebound sets the stage for a run at $21.71. The oracle network's token is showing more resilience than your average crypto 'stablecoin' during a Twitter spat.
Key levels holding? Check. Trading volume confirming the move? That's the million-dollar question. Meanwhile, traditional finance still can't decide if this is 'digital gold' or a glorified API subscription.
One thing's clear: in a market where most alts bleed out, Chainlink keeps writing its own rules. Whether that continues depends on whether $21.71 becomes a springboard or a ceiling.

Despite short-term weakness, on-chain data and key indicators reflect growing investor confidence.
Technical metrics continue to suggest accumulation, even as LINK consolidates below its breakout zone. Market behavior now focuses on whether bulls can push through the critical $19.50 resistance toward the $21.71 ceiling.
Technical Structure Holds as LINK Stalls Below Resistance
On the daily chart, LINK is trading at $18.42, reflecting a 1.66% intraday gain. The price action since early June has maintained a rising trend, forming higher lows and higher highs. However, a recent rejection at $19.53 has created a near-term ceiling.
This level aligns with the upper resistance zone between $19.50 and $21.70, which marked the peak of LINK’s last rally. Until a breakout occurs above this zone, LINK remains locked in consolidation.
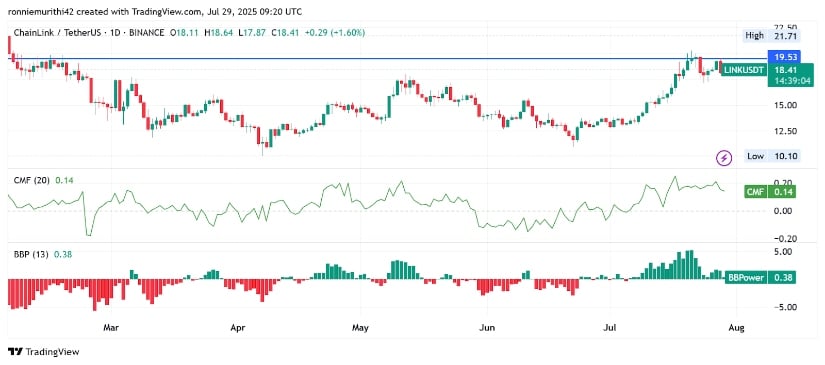
Source: TradingView
The Chaikin Money FLOW (CMF) stands at +0.14, suggesting net capital inflows are still dominant. This indicates continued buying pressure despite the recent stall. Throughout July, CMF readings have remained positive, signaling accumulation over distribution.
This sustained trend supports the view that investors are positioning for a potential MOVE higher. However, for a breakout to be confirmed, rising volume must accompany a daily close above $19.53.
The Bull and Bear Power (BBP) indicator currently reads +0.38. While this shows bulls still control momentum, the recent flattening of the BBP histogram indicates waning strength. This stagnation NEAR resistance could point to either consolidation or buyer fatigue.
A renewed push above $19.50, accompanied by an uptick in BBP, WOULD reinforce bullish bias. Conversely, a failure to sustain current levels may invite a retest of support near $17.00.
Short-Term Pressure Evident in 24-Hour Price Action
In the 24 hours from July 28 to July 29, LINK price declined by 5.95%, dropping from around $19.40 to $18.06. This downward trajectory marked a break below intraday support, indicating temporary weakness. The session saw the steepest drop occur in the early hours of July 29, with pressure likely stemming from profit-taking or broader market correction.
Despite the sell-off, trading volume reached approximately $693 million, showing strong participation. The steady increase in trading activity toward the session’s end may imply renewed interest at lower levels.
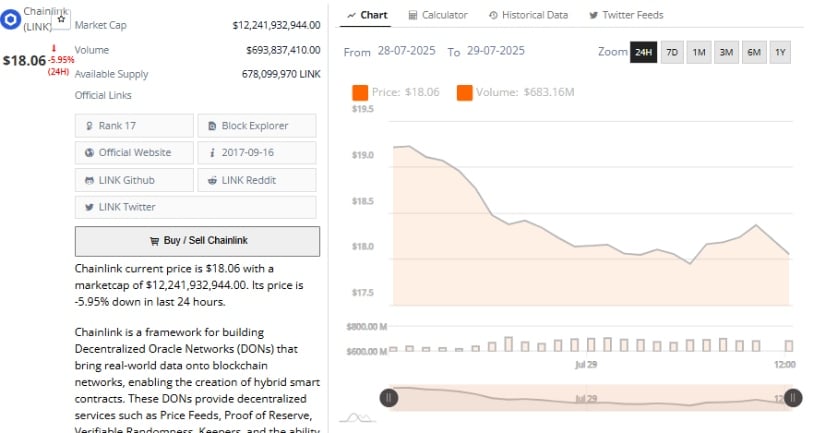
Source: BraveNewCoin
Buyers possibly entered near the day’s low, or short positions were covered. LINK briefly recovered to $18.20 before settling at $18.06, but this rebound lacked volume and failed to clear nearby resistance. Stability above $18.50 is needed to reestablish bullish momentum.
While short-term sentiment weakened, the long-term structure remains intact. The $17.00 level now acts as psychological support, and holding above this zone may prevent deeper corrections. If LINK climbs above $19.50 in the coming sessions, bullish conviction will likely grow stronger, setting the stage for a possible move toward $21.71.
At the Time of Writing: Exchange Balance Trends Support a Bullish Outlook
As of late July, on-chain data from Coinglass highlights a notable downtrend in LINK balances held on centralized exchanges. The current balance has declined to 130 million LINK, down from over 160 million in March.
This drop suggests reduced sell-side risk, as fewer tokens are available for immediate trading. Typically, falling exchange reserves are interpreted as a sign of long-term accumulation or staking behavior.
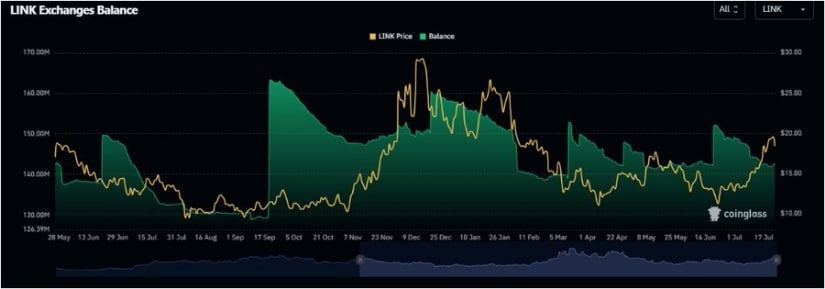
Source: X
Earlier in the year, spikes in exchange balances coincided with price rallies, as holders moved LINK to exchanges likely to sell during peaks. The recent pattern, however, shows a reverse trend.
Lower balances have coincided with a steady recovery from $13 to above $18. Arca’s observation that exchange balances are “moving in the right direction” underscores this dynamic. If supply continues tightening while demand grows, it may act as a tailwind for LINK to approach or retest the $21.71 level.
