🚀 Ethereum (ETH) Price Surge: ETF Inflows Spark Supply Crunch Panic as $4,000 Breakout Looms

Wall Street's latest crypto craze just lit a fire under Ethereum—and the burn rate is staggering.
The ETF effect: Institutional greed meets blockchain scarcity
BlackRock's ETH ETF filing last week triggered a stampede of institutional capital, sucking up exchange reserves faster than a DeFi exploit drains a liquidity pool. Suddenly, everyone's realizing there might not be enough ETH to go around.
$4K or bust: Technicals scream breakout
The charts look like a laser beam—no resistance until the psychological $4,000 level. Options traders are piling into calls, while shorts get liquidated faster than a leveraged farmer during a flash crash.
The cynical take: Nothing makes finance bros believe in decentralization like the chance to repackage it as a shiny ETF. The irony? They're accelerating the very supply shock they're trying to profit from.

Institutional demand is building momentum as ethereum nears the key $4,000 resistance level. Combined with increased staking and Layer 2 growth, this surge could spark Ethereum’s next major rally. Traders are now watching closely to see if ETH can sustain a breakout and reach new multi-year highs.
Ethereum Price Today: Bullish Momentum Builds Near $4,000
Ethereum (ETH) surpassed $3,900 today, as institutional staking and escalating ETF demand continue to fuel its surge. ETH is now consolidating just below a crucial resistance zone. Analysts are now eyeing a breakout that could propel Ethereum toward $4,500 or even $4,800.
Ethereum nears $4,000 — just one explosive daily candle away from rewriting the charts. The “God candle” may be coming! Source: Henry via X
Within the past 24 hours alone, ETH trading volume spiked nearly 60%, while open interest ROSE 6–7% to over $59 billion, pointing to rising institutional conviction. ETH currently trades above all major exponential moving averages (EMA), reflecting a bullish alignment of trend structure and momentum
Technical Landscape: Resistance, Liquidity, and Trend Strength
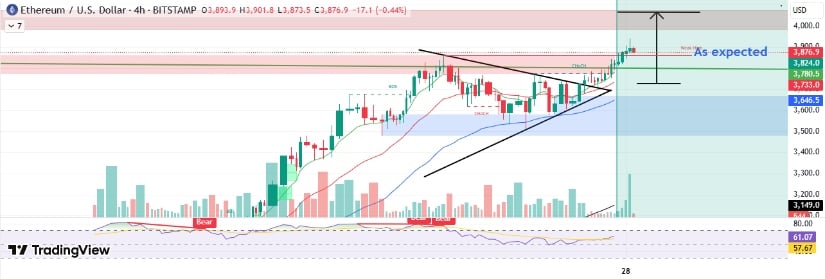
Ethereum has now clearly broken out of a multimonth downtrend, entering a bullish structure NEAR the $3,920–$3,950 zone. Technical indicators show ETH riding the upper Bollinger Band while bouncing off VWAP support near $3,883, pointing to sustained upward pressure. The RSI, which cooled slightly from 66 to 62, suggests controlled strength rather than overbought fatigue.
Ethereum (ETH) eyes $4,500 breakout as price holds above $3,900, ETF demand surges, and trading volume spikes 60% in 24 hours. Source: pratikbabu09 on TradingView
If ETH breaks above the $4,089 swing-high — the upper boundary of a key liquidity zone — analysts expect the trend to continue toward $4,300, with further upside toward $4,500. That zone has acted as distribution territory in the past, and surpassing it WOULD mark a major structural breakout. A failure here may prompt a re-test of support between $3,754 and $3,680, a zone aligned with prior breakout levels and EMA support clusters.
Ethereum ETF Inflows Raise Supply Shock Concerns
One of the strongest catalysts behind Ethereum’s rally is the continuous inflow into spot Ethereum ETFs. Over the past 17 consecutive trading days, Ethereum ETFs have recorded historic net inflows, with $453 million on Friday alone. This brings the total ETF assets under management to $20.66 billion.
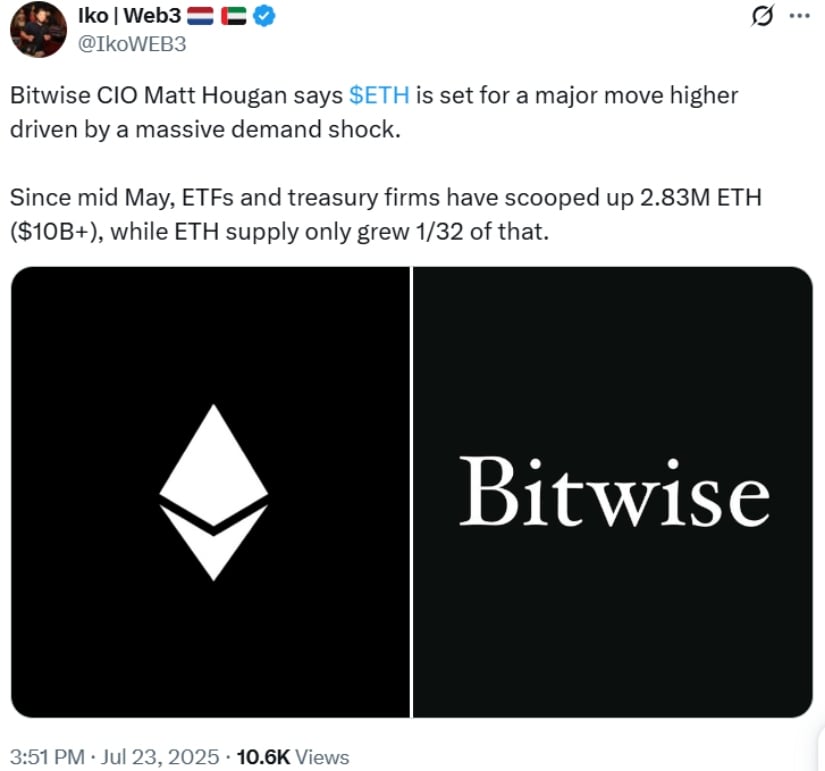
Ethereum set for a breakout as $10B ETF demand dwarfs supply growth, says Bitwise CIO. Source: @IkoWEB3 via X
Leading this surge, BlackRock’s ETHA ETF attracted $440 million in a single day, placing it among the top-performing U.S. ETFs for the week. The trend signals a significant rise in institutional demand for Ethereum-based financial products.
Analysts estimate that, at the current pace, ETF demand could reach $20 billion in the coming year, equivalent to approximately 5.33 million ETH. In contrast, Ethereum is expected to issue only 0.8 million ETH during the same period. This creates a potential sevenfold mismatch between supply and demand — a scenario that could lead to a significant supply shock in the market.
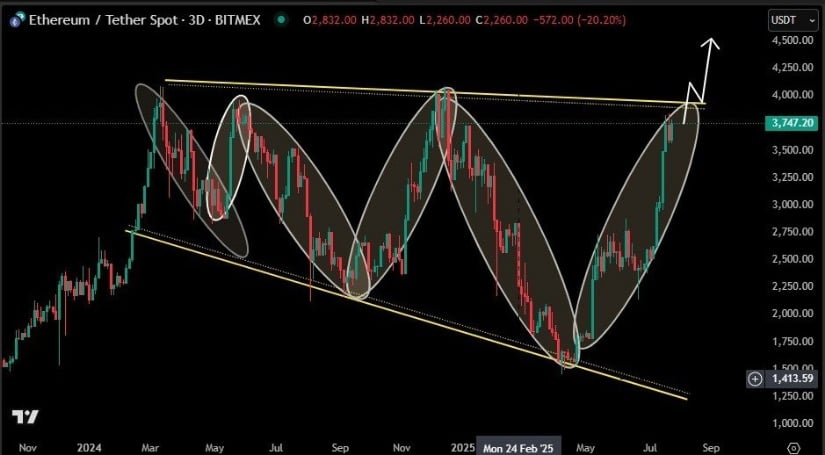
This supply-demand imbalance is further supported by technical data. A diamond pattern formation on Ethereum’s 3-day chart is nearing completion around $2,832, typically a sign of a powerful reversal pattern. The breakout from this structure has reinforced bullish expectations, with measured projections pointing to $4,000 to $6,000 price targets.
Institutional Accumulation Deepens: SharpLink Buys $295M ETH
SharpLink Gaming, a major player in the gaming sector, recently expanded its Ethereum holdings by purchasing 77,210 ETH over the weekend, worth approximately $295 million. This brings the company’s total ETH holdings to 438,017 ETH, valued at around $1.69 billion, with more than 95% of these assets either staked or deployed on liquid staking platforms.
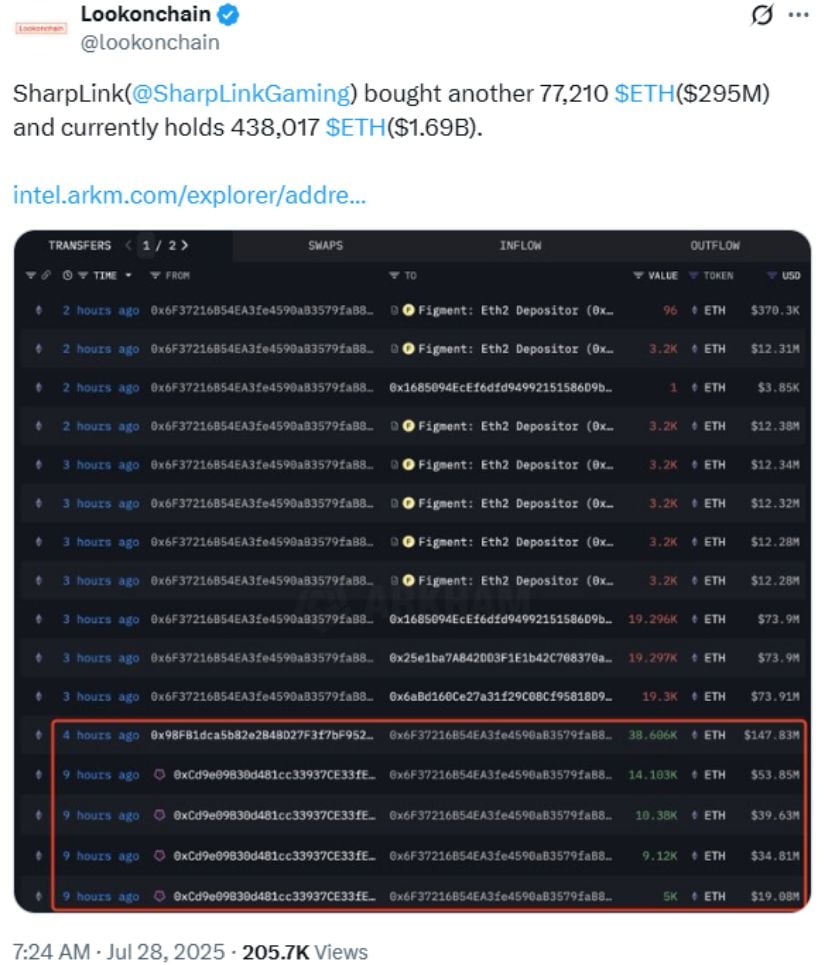
SharpLink adds 77,210 ETH worth $295M — now holds 438,017 ETH valued at $1.69B, fueling bullish momentum. Source: Lookonchain via X
SharpLink coordinated with Galaxy Digital for the transaction, with on-chain data showing $148 million worth of ETH transferred from Binance as part of the deal. The company emphasized the operational advantage of Ethereum’s 24/7 functionality compared to traditional banking hours, highlighting its strategic interest in long-term ETH exposure and staking rewards.
This massive purchase also positions SharpLink ahead of firms like Coinbase and Bitmine in terms of Ethereum holdings, signaling an emerging trend where corporate treasuries are increasingly leaning into ETH for long-term yield and network participation.
Ecosystem Tailwinds: Seasonality & Layer 2 Expansion
Ethereum’s impressive 50% price surge in July sets the stage for its historically strongest month — August. In previous post-halving cycles, Ethereum has delivered average August gains of 64.2%, often pushing the asset into key breakout levels like the $4,000 to $6,000 range.
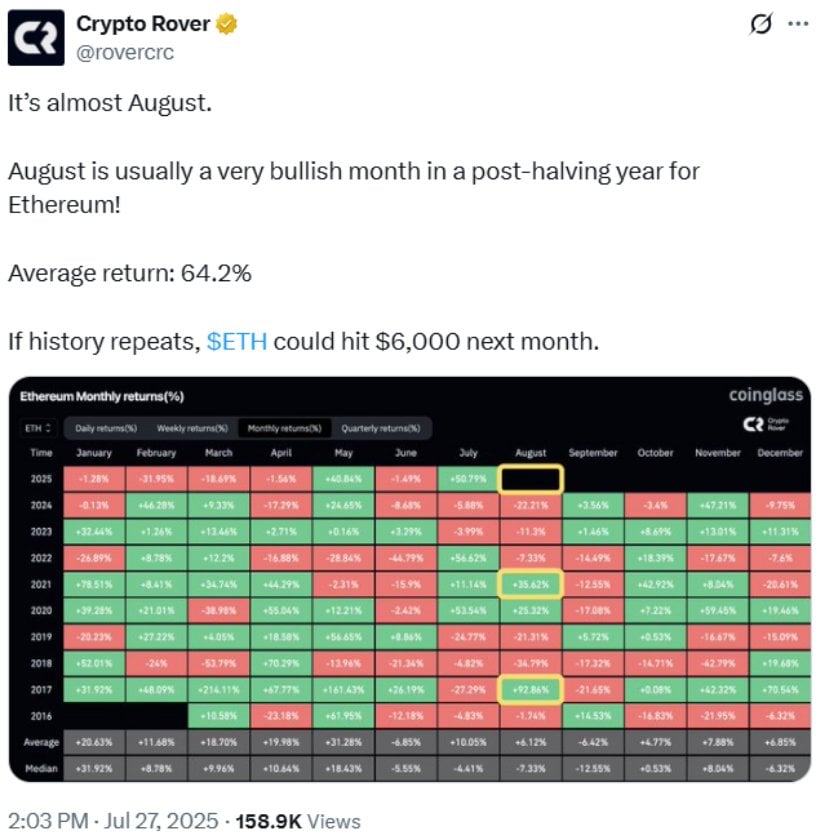
August could send Ethereum (ETH) to $6,000 — post-halving history shows 64.2% average gains for the month! Source: @rovercrc via X
At the same time, Ethereum’s Layer 2 ecosystem — led by platforms like Arbitrum, Optimism, and zksync — continues to expand. Increasing Layer 2 transaction volume and reduced gas fees are driving higher user engagement across decentralized applications. As these scaling solutions mature, they reinforce Ethereum’s core utility by channeling more transactions, value, and activity back to the Ethereum mainnet.
Ethereum Outlook: What Comes Next?
Looking ahead, Ethereum’s price movement will likely depend on whether it can break and sustain levels above $4,089. Should this happen, ETH could enter a new leg of price discovery with minimal overhead resistance until $4,800.
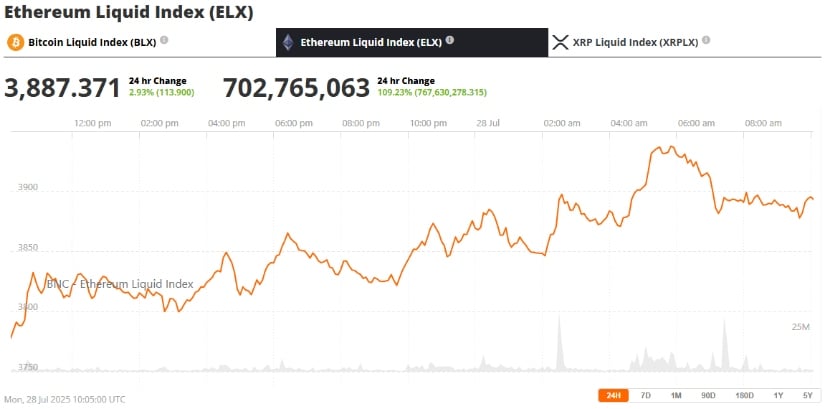
Ethereum (ETH) has been trading at around $3,887, up 2.93% in the last 24 hours at press time. Source: Ethereum Liquid Index (ELX) via Brave New Coin
However, even if the breakout momentarily stalls, the technical and fundamental backdrop remains bullish. As long as Ethereum holds above its support range of $3,680 to $3,754, the broader uptrend remains intact.
With institutional inflows accelerating, ETF demand outpacing new ETH issuance, and seasonal patterns aligning in Ethereum’s favor, market sentiment leans bullish. While speculative, some traders are already preparing for the possibility of $6,000 ETH in the coming months — especially if August delivers another historic rally.
