Solana Primed for $220 Surge: On-Chain Gaps and Rock-Solid Fundamentals Signal Imminent Breakout

Solana's price action is flashing bullish signals that even Wall Street's most jaded chartists can't ignore. The blockchain's ironclad fundamentals and critical on-chain metrics suggest a breakout that could leave latecomers fumbling for buy buttons.
Why $220 isn't just hopium
Network activity and developer momentum have turned SOL into a freight train—while other chains struggle with 'high-performance' claims, Solana keeps processing transactions like a caffeine-fueled quant at market open. The $220 target isn't technical analysis astrology; it's simple math based on liquidity gaps in the order books.
Institutional money's worst-kept secret
Hedge funds might still pretend to care about ETH killers, but their algo wallets tell the real story: SOL accumulation patterns mirror 2021's bull run setup. Meanwhile, retail traders remain distracted by meme coins—classic.
Watch for the liquidity grab
When SOL slams through resistance, it won't be pretty for shorts. The coming move could happen faster than a leveraged trader's margin call. Just remember: in crypto, even sure bets require stronger hands than your average VC's HODL discipline.

Solana price is starting to reclaim key levels with momentum and on-chain confirmation. Market participants now believe that SOL may be gearing up for a major move, particularly with the price approaching the $190 to $200 range.
Solana Price Breaks Out with OBV Confirmation and Targets in Sight
Solana price is kicking off the week with a clean breakout above its previous consolidation zone, backed by rising volume and strong OBV (On-Balance Volume) confirmation. The chart shared by Tang highlights a successful retest of the $180 to $185 region, which previously acted as resistance and now appears to be flipping into support. Technically, this breakout also clears the 0.236 Fib level from the previous macro downtrend, setting the stage for a potential trend continuation.
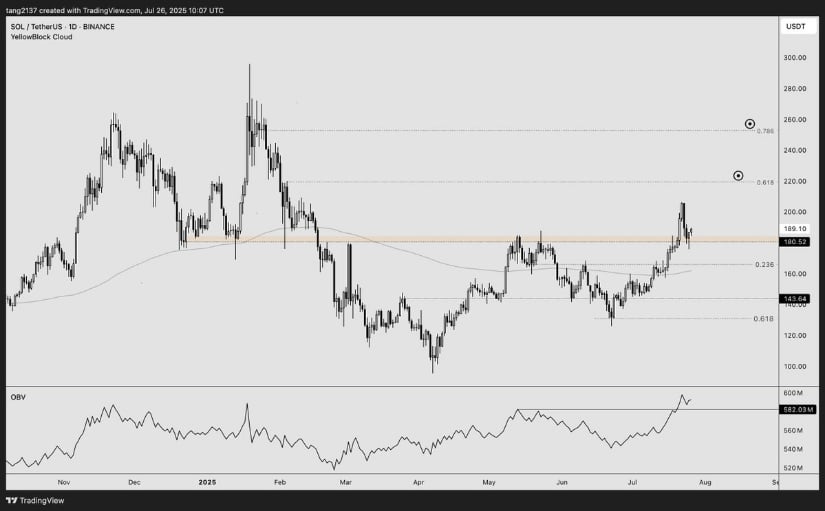
Solana reclaims key support with rising OBV and volume, signaling a potential MOVE toward $220 and beyond. Source: Tang via X
The OBV line suggests that the recent price move is backed by actual inflows. With the 200-day moving average also trending beneath price, the path of least resistance remains upward. If momentum holds and buyers continue to defend this range, the next key zones to watch are $220 and $250, both of which align with historical resistance levels and Fibonacci pivots.
Solana Liquidation Heatmap Flags Key Short Cluster Near $200
While Solana’s breakout has grabbed attention on traditional charts, the latest liquidation heatmap shared by CW8900 reveals where the real pressure might be building. According to the visual, a dense cluster of short liquidations is stacked between the $190 to $200 levels.
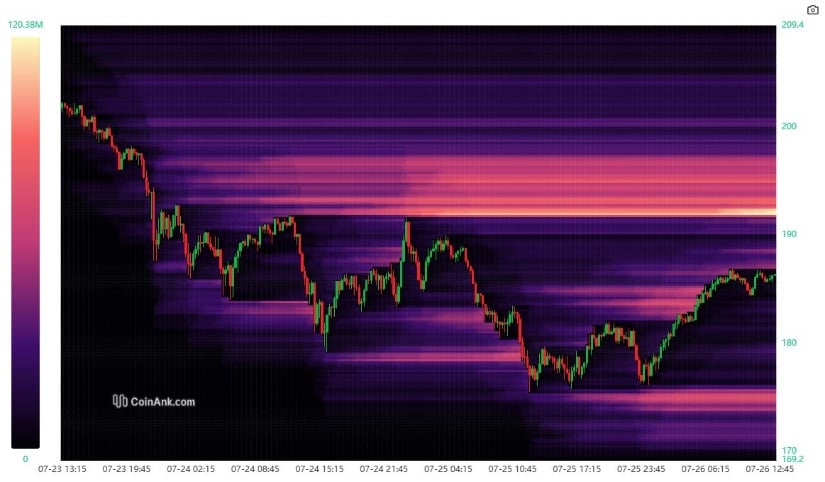
Solana’s liquidation heatmap reveals heavy short interest between $190–$200, setting the stage for potential short squeezes. Source: CW8900 via X
These liquidation zones often act as magnets for price during momentum-driven runs, as the market naturally seeks out pockets of liquidity to trigger liquidations and fuel continuation.
It’s worth noting that while OBV and structure suggest bullish momentum is in play, this heatmap paints a more tactical picture. If solana can push into the $195+ zone with volume, it could trigger a chain reaction of short squeezes, further boosting the move toward the $220 target.
Solana URPD Shows Open Sky Above $200
Adding to the bullish buildup, Ali’s latest URPD (UTXO Realized Price Distribution) chart paints a compelling picture for Solana once it breaks the $200 mark. The data highlights that a majority of SOL’s trading activity is still concentrated below that level, meaning most holders are already in profit and there’s minimal supply waiting to sell above. Structurally, this creates what’s often referred to as a “thin zone”, an area where price can move quickly due to the absence of heavy volume resistance.
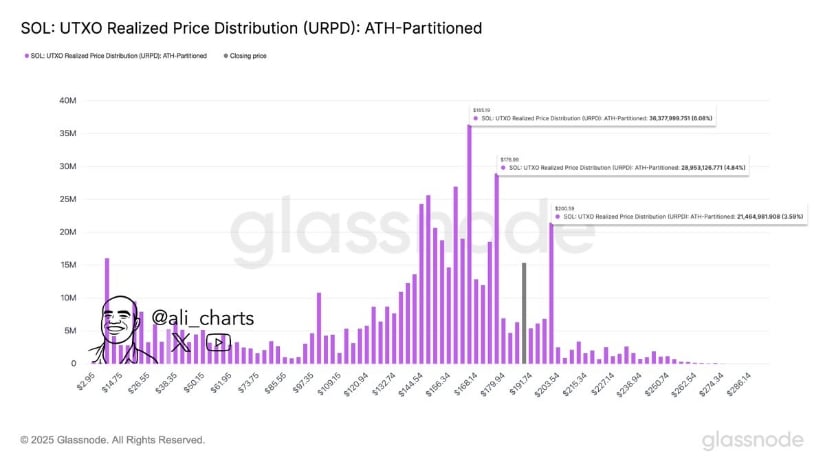
Solana’s URPD chart highlights a “thin zone” above $200, suggesting minimal resistance and room for rapid price expansion. Source: Ali via X
If SOL clears $200 with momentum, it wouldn’t be running into walls of trapped liquidity like it did between $150 and $180. Instead, there’s a clean volume gap on-chain, potentially opening the way for price to revisit prior highs and even test new ones.
Solana’s Network Fundamentals Remain Strong
Solana’s Core fundamentals are now flashing green as well. According to data shared by CryptosRus, Solana has just hit an all-time high in weekly transaction volume alongside a sustained uptick in average TPS (transactions per second).
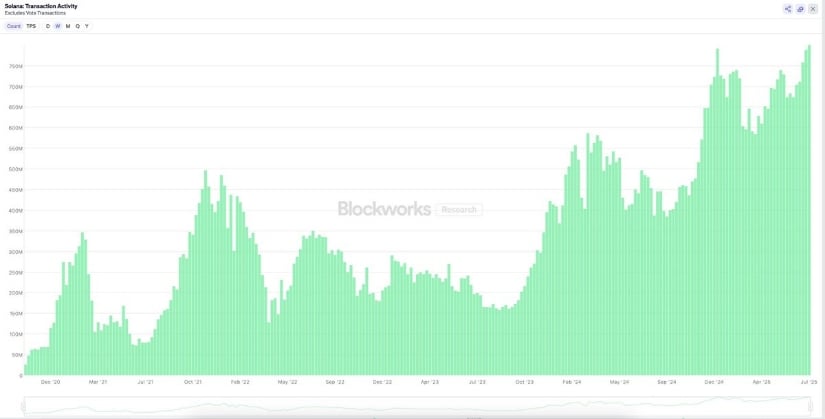
Solana hits record-high weekly transactions and rising TPS, signaling real network growth beyond speculative hype. Source: CryptosRus via X
Blockworks chart shows a clear, steady surge in activity, confirming that usage isn’t just speculative, it’s accelerating at the protocol level. In Q4 2024 alone, revenue touched $800 million, putting Solana in direct competition with ethereum and even traditional financial rails.
This kind of strength adds critical context to the $200 breakout zone.
Inverse Head-and-Shoulders Pattern Targets $215 on Solana
A fresh chart from Abid Ali Jaffery highlights a developing inverse head-and-shoulders pattern on Solana’s lower timeframes. The neckline, drawn NEAR the $189 to $190 region, is being repeatedly tested, and a confirmed breakout above this zone could trigger a measured move towards the $210 to $215 range.
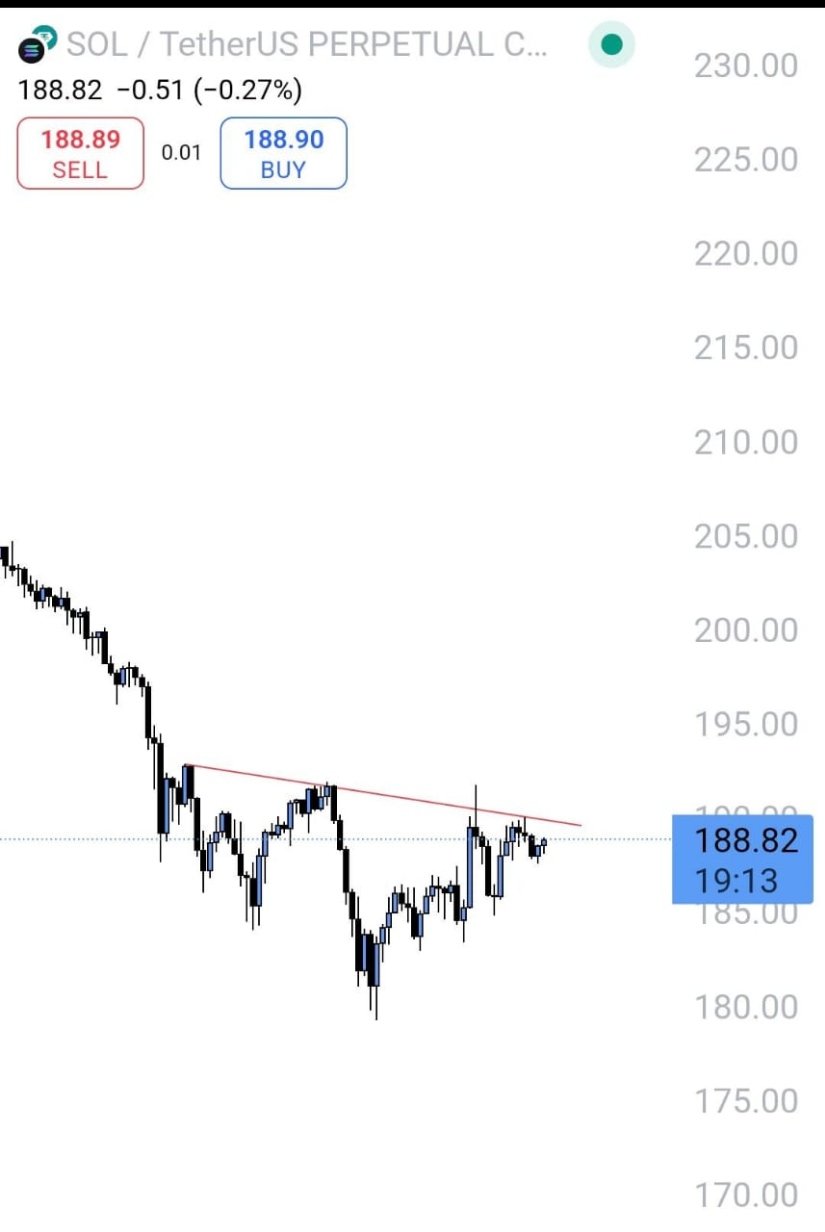
Solana forms an inverse head-and-shoulders with a neckline near $190, eyeing a breakout toward the $215 target. Source: Abid Ali Jaffery via X
In the context of URPD data and on-chain fundamentals, this pattern may be the trigger that carries the SOL Solana price back above the $200 mark.
Final Thoughts
Solana’s breakout isn’t just about price; it’s a mix of technical confirmation, smart money flows, and real on-chain strength. With volume rising, OBV climbing, and the $180 to $185 zone flipping into support, the foundation looks solid.
The emerging inverse head-and-shoulders pattern could be the final spark. If Solana Price manages to flip $190 to $195 with strong momentum, it’s likely to see solana price prediction point towards the $210 to $215 targets.
