Chainlink Defies Gravity: Multi-Year Breakout Confirmed as Price Holds Critical Support

Oracle giant Chainlink isn't asking for permission—it's rewriting the rulebook. A textbook technical setup suggests the crypto's grinding consolidation phase may finally be over.
The breakout traders can't ignore
After years of false starts, LINK's chart prints the kind of structure that makes technical analysts reach for their checkbooks. That 'support' everyone's been watching? Still holding—despite the usual suspects calling for a crash.
Why this time might actually be different
Unlike 2021's hype cycle (or 2023's dead-cat bounce), this rally's got the hallmarks of institutional accumulation. The kind of slow, boring uptrend that Wall Street 'geniuses' will claim they predicted all along.
One thing's certain: if LINK holds this level, even the crypto skeptics will suddenly remember how to read a candlestick chart.

Recent chart updates from top analysts highlight a key breakout structure forming across both short- and long-term timeframes. chainlink price has steadily rebounded from local lows, climbing over 16% this week and holding above critical support levels.
On the 4-hour and 15-day charts, analysts CW and Captain Faibik point to potential breakout zones between $25 and $27, while noting chainlink multi-year consolidation pattern may be nearing completion. As trading volume remains high and sentiment shifts bullish, Chainlink could be gearing up for a major move, positioning itself at the forefront of the next altcoin rally.
Chainlink Price Holds Support as Multi-Year Breakout Structure Emerges
Chainlink (LINK) Price maintained its support zone and continued to trade near $18.26, up 2.89% over the last 24 hours. Chainlink price action signals steady recovery after a dip below $17.50 earlier in the session. Buyers stepped in quickly, pushing the token back above the $18.00 mark. Throughout the session, LINK formed a sequence of higher lows, maintaining a stable upward structure on the short-term chart.
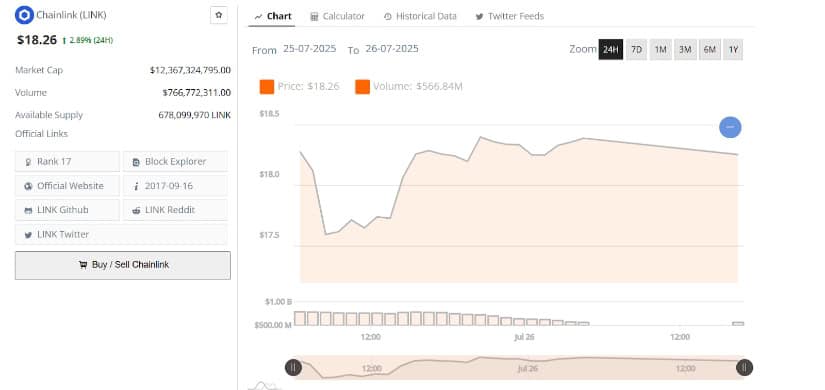
Source: BraveNewCoin
Total trading volume over the 24-hour period reached $766.77 million, indicating consistent market activity. Although volume tapered off toward the close, LINK’s market capitalization remained strong at approximately $12.36 billion. The recovery shows that the $18.00 level is holding as a near-term support base, which is now essential for maintaining the current upward structure.
Resistance Zones Near $20 While $26 Remains in Focus
LINK price behavior is encountering resistance between $19.00 and $20.00. Analyst CW shared a 4-hour chart marking this area as the next key hurdle for buyers. The Chainlink price peaked near $20 before retracing slightly and now consolidates just below this resistance band. With the token currently at $18.34, ChainLink price action remains within range of a potential breakout toward the next level at $26.00.
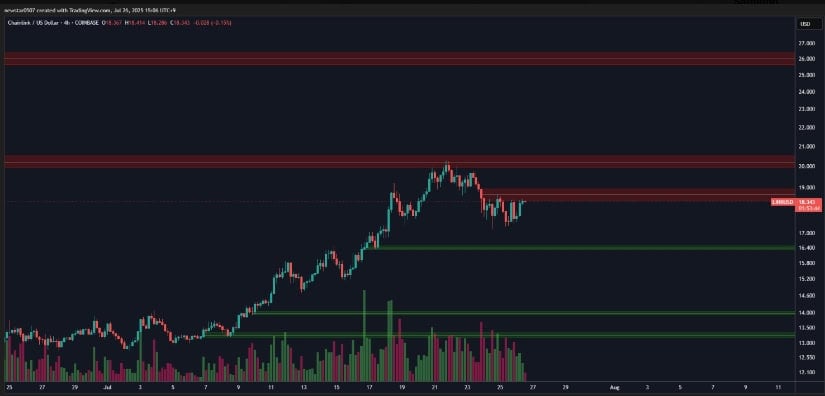
Source :X
Volume indicators during the current structure show increased activity on upward candles, signaling that buyers are still active. Support zones are present around $16.40 and $15.20. These areas have seen strong accumulation, acting as buffers during previous pullbacks. If LINK clears the $20 mark with follow-through volume, a MOVE toward $26.00 could develop as part of the ongoing bullish cycle.
Multi-Year Triangle Formation Approaches Apex
According to analyst Captain Faibik, Chainlink is forming a symmetrical triangle pattern on the 15-day chart, with compression between an ascending support line and descending resistance. This structure has been developing since 2020, and LINK is now approaching the apex. As of the latest reading, LINK trades NEAR $18.36, having posted a 16.57% gain recently.
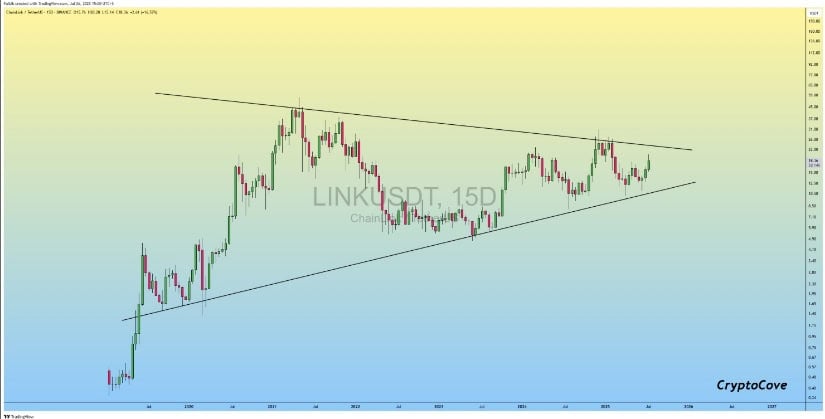
Source:X
The pattern represents an extended period of consolidation. The current movement near the lower trendline signals renewed interest, especially as price begins testing the upper boundaries. The breakout potential from this formation is increasing as the range narrows. The next key zone to watch is between $25.00 and $27.00, which could act as a trigger point if broken.
Trend Structure Holds Despite Consolidation
LINK macro trend remains intact despite recent sideways movement. The lower boundaries of the symmetrical triangle continue to offer structural support. Daily candlestick formations suggest that buyers remain active around the $17.50–$18.00 area. Moreover, the ability to FORM higher lows in this region contributes to the broader bullish structure, even amid short-term pullbacks.
Indicators such as RSI and MACD remain neutral to positive, showing no immediate threat of trend breakdown. Traders appear focused on maintaining accumulation within the current range. If support zones continue to hold and volume resumes on upward moves, LINK may attempt to reclaim previous highs above $20 before testing the long-term breakout levels near $26.

Log in to Reply
Log in to comment your thoughtsComments
Related Articles
|Square
Get the BTCC app to start your crypto journey
Get started today Scan to join our 100M+ users