Uniswap Bulls Charge: UNI Defends Critical Support as $11.80 Breakout Looms in July 2025 Rally

DeFi's favorite DEX token flexes resilience—holding key levels while traders pile into long positions. The $11.80 resistance isn't just a number; it's the line between consolidation and a full-blown altseason breakout.
Market Pulse: UNI's Silent Accumulation Phase
Whispers of 'buy the dip' echo across Crypto Twitter as UNI's chart paints a textbook bullish reversal pattern. Liquidity pools swell—smart money's positioning for volatility.
Make or Break: The $11.80 Psychological Barrier
Every trader's screen lights up with the same Fibonacci level. Break past it, and FOMO kicks in. Fail, and well... at least the gas fees are lower these days (there's your cynical finance jab).
Active whales, dormant chains—this isn't your 2021 meme coin rally. UNI's price action moves like a protocol that actually generates revenue. Imagine that.

Market participants are closely watching the $11.80 resistance level for signs of a potential breakout. Volume activity and technical positioning indicate sustained interest from both retail and institutional sides.
Uniswap Price Support Retest Confirms Market Structure
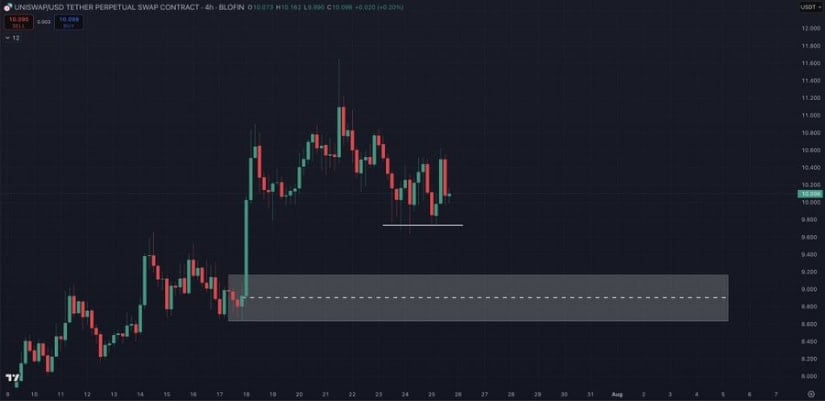
The 4-hour chart provided by analyst crypto Chiefs (@cryptochiefss) outlines a well-established horizontal support level near $9.90. This area served as a pivot for a local double-bottom structure, which has since led to a short-term rebound.
Price reclaimed the $10.20 mark, which signals that buyers are actively defending the zone and that selling pressure has been absorbed. The symmetrical nature of the candles NEAR the support base points to a balance between demand and supply with a slight bullish edge.
Source: X
A broader demand block between $8.90 and $9.40 remains untested following July’s breakout. The grey zone highlighted in the chart may act as a strong fallback level if the price reverts below $9.90.
Market participants often view such unfilled liquidity zones as critical for future reaction. As long as UNI trades above the neckline support, the short-term structure remains intact, favoring a revisit of the $11.00 to $11.80 resistance area.
UNI Builds Momentum Around Psychological Threshold
On the 24-hour price chart, UNI gained 6.31% over the session to close near $10.51. Price action during the day featured a breakout above $10.00, followed by tight consolidation between $10.35 and $10.55.
This tightening price range near session highs indicates that profit-taking remains limited and buyers are prepared to defend recent gains. The asset’s strong recovery after brief intraday dips further confirms resilience in the current trend.

Source: BraveNewCoin
Trading volume over the 24 hours reached $594.16 million, confirming that the MOVE was supported by consistent liquidity. The market cap stands at $6.31 billion, with a circulating supply of 600.48 million UNI tokens.
If the token maintains its range above $10.30 and volume persists or increases, a test of the $10.60 resistance becomes more likely. Should selling pressure re-emerge, a retracement toward the $10.00 psychological level remains within expectation, though no breakdown has materialized yet.
Momentum Indicators Align With Bullish Continuation at Time of Writing
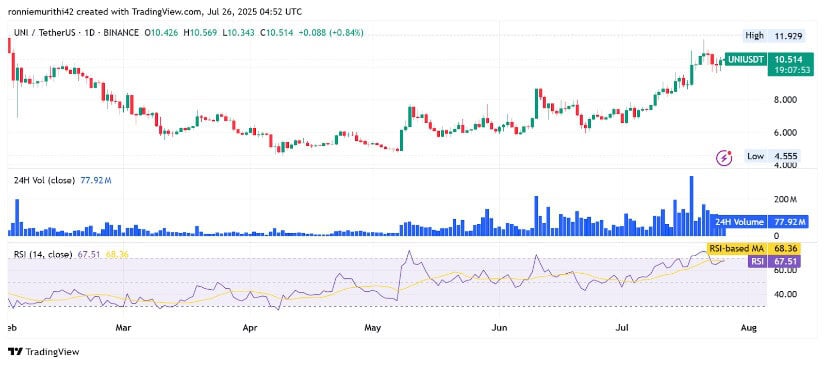
At the time of writing, UNI is trading at $10.534 after gaining 1.04% on the day. The Relative Strength Index (RSI) on the daily chart is at 67.66, nearing the overbought threshold of 70 but still signaling strong momentum.
The RSI-based moving average is slightly higher at 68.37, further supporting the strength of the ongoing trend. A move above the 70 level could signal increased buyer aggression and align with a breakout attempt beyond $11.80.
Source: TradingView
Volume remains relatively strong at 78.14 million UNI. Previous spikes in volume have been aligned with breakout candles, confirming that the bullish moves were not isolated or liquidity-driven.
If RSI and volume rise concurrently while price maintains above the $10.30–$10.50 region, UNI may revisit its previous high of $11.929. Traders will likely monitor for any RSI divergence or volume fade as early indicators of trend fatigue. Until then, the technical setup favors continuation within a bullish
