Hyperliquid (HYPE) Primed for Breakout: Bullish Divergence Meets Supply Burn Frenzy

Hyperliquid (HYPE) is flashing bullish signals as technicals and tokenomics collide. A textbook bullish divergence on the daily chart coincides with a aggressive supply burn mechanism—fueling speculation of an imminent breakout.
Supply Shock Looms
The project's deflationary model has already torched a chunk of circulating supply. With buy pressure building and fewer tokens in play, HYPE could be setting up for a liquidity squeeze.
Technical Sweet Spot
RSI divergence suggests weakening selling pressure despite recent price consolidation. The chart's forming a potential springboard pattern—favorite setup of degens and institutional traders alike.
Just don't tell the 'efficient markets' academics—they're still busy writing papers about how crypto valuations make no sense while missing every major trend.

HYPE bulls are closely eyeing the $41 support zone, where buybacks, strong fundamentals, and bullish divergences are all stacking up. According to crypto analyst Borz, this golden pocket region could act as the springboard for a rally towards $45.80 and beyond, especially if the hidden bullish divergence plays out.
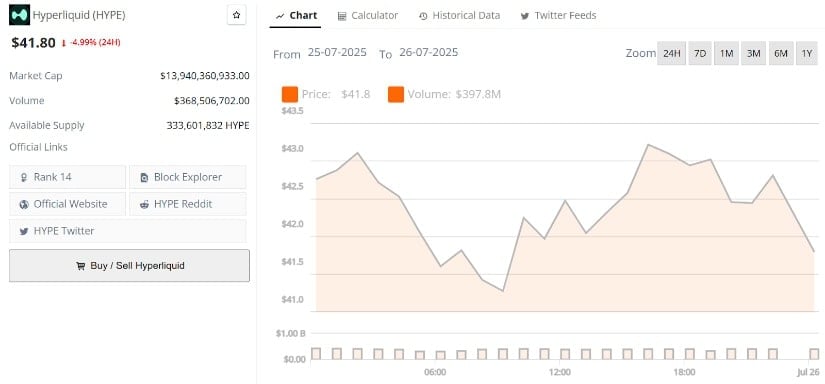
Hyperliquid’s current price is $41.80, down -4.99% in the last 24 hours. Source: Brave New Coin
Hyperliquid Buybacks Step Up When the Market Pulls Back
While most tokens tend to struggle during market crashes, Hyperliquid is built a little differently. When prices drop and trading activity picks up, the protocol collects more fees, and those fees go straight into buybacks. As DeFi Warhol pointed out, this helped HYPE stay surprisingly strong back in April when the rest of the market was falling apart.
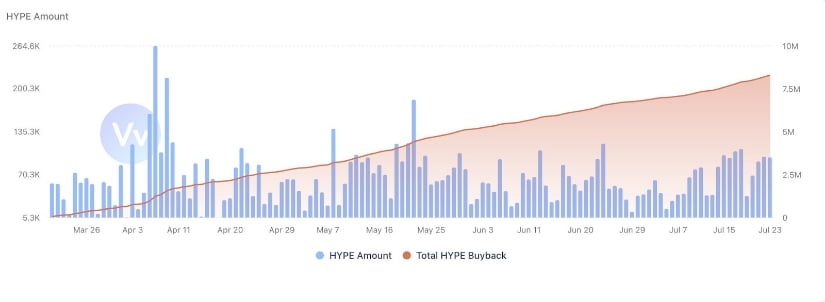
Hyperliquid ramps up buybacks during market dips, turning volatility into opportunity. Source: DeFi Warhol via X
The chart from Defi Warhol shows that as the market dropped, buyback activity picked up fast. Since Hyperliquid’s system automatically ramps up buybacks when volume rises, it’s one of the few projects that can benefit from volatility instead of being hurt by it.
Hyperliquid Buybacks Could Cover Entire Supply in Just 2.7 Years
If the last chart showed how Hyperliquid thrives when the market dips, this one zooms out and shows the bigger picture. According to data shared by Ghazzog, with current daily revenue hovering around $4.1 million, the Assistance Fund could theoretically buy back the entire HYPE supply in just 2.71 years.
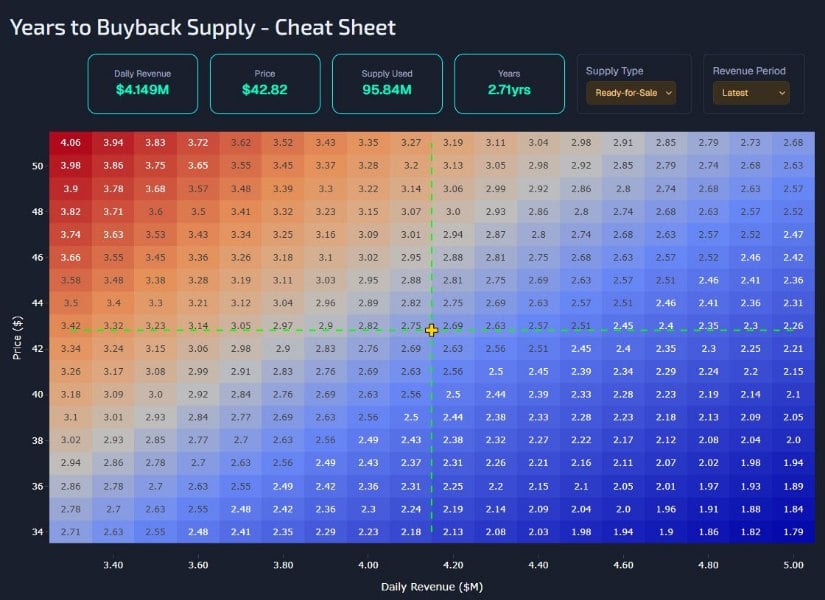
At current revenue rates, Hyperliquid’s buybacks could retire the entire token supply in just 2.7 years. Source: Ghazzog via X
That kind of consistent buyback pressure can have a real impact on price over time. With supply steadily being reduced and demand holding strong, especially during volatile periods, this creates a powerful setup for long-term price appreciation
Hyperliquid Eyes Hidden Bullish Divergence as It Tests Golden Pocket
After two strong narratives around buybacks, this latest chart from crypto analyst Borz shifts the focus back to price action, and it’s a crucial one. Hyperliquid has now retraced into the golden pocket zone between $40.20 and $41.50, a Fibonacci-based area often seen as prime support during healthy pullbacks. At the same time, RSI on the 8H timeframe is printing higher lows while price remains relatively flat, hinting at a potential hidden bullish divergence brewing beneath the surface.
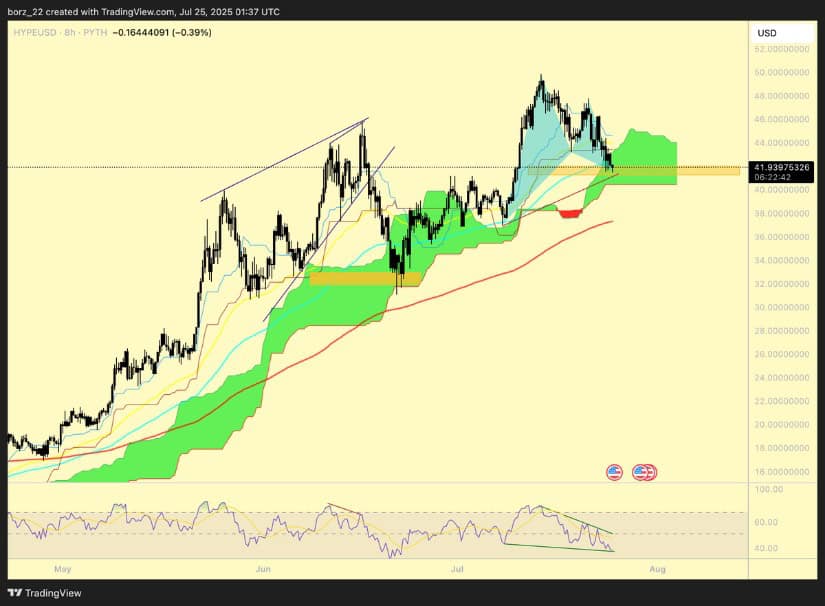
Hyperliquid tests key Fibonacci support as hidden bullish divergence hints at a possible rebound. Source: Borz via X
If this divergence confirms and the golden pocket holds, the next upside targets to watch are $45.80 as immediate resistance and $50 as a psychological milestone. On the downside, if $40 fails to hold, the next support zone sits NEAR the $37.20 to $38.00 range, where the 100 EMA is also hovering.
HYPE Technical Analysis
This latest chart from Khan adds to the growing technical story around HYPE by laying out a clear reaction zone between $41.00 and $41.80. This green demand area has acted as support multiple times, and the price is once again hovering just above it. The chart also suggests two possible paths from her, a direct bounce toward the $45.70 resistance, or a final sweep of the lows before a stronger push higher.
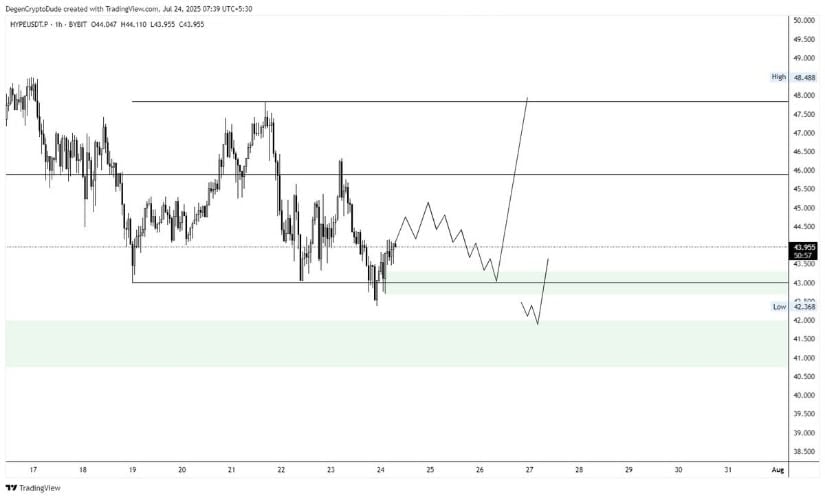
HYPE hovers above a key demand zone, with bulls eyeing a bounce toward $45.70 and $48.60. Source: Khan via X
If bulls manage to defend this zone, the next upside levels to watch are $45.70, followed by $48.60, where previous rejections occurred. However, if the $41 level breaks down, eyes will shift toward the lower support around $39.20.
Final Thoughts: Will Hyperliquid Manage $50 In July?
The setup around Hyperliquid is becoming hard to ignore. You’ve got strong buyback mechanics kicking in during volatile periods, a deflationary model, and technicals pointing toward a bounce from the golden pocket. Add to that a possible hidden bullish divergence and a clean demand zone holding firm, and suddenly, that $50 level doesn’t seem so far-fetched.
Still, the next few days will be crucial. If bulls can defend the $41 zone and reclaim $45.70, a push toward $48.60 and eventually $50 could come quicker than expected. But if that support cracks, short-term pressure could drag it down to $39.
