Floki Price Hits a Wall: Can the Memecoin Break Through Key Resistance?

Floki's bullish momentum just slammed into a brick wall. The memecoin—once riding high on its ascending base pattern—now faces stiff resistance after a sharp breakdown. Traders are left wondering: Is this a temporary setback or the start of a deeper correction?
Technical signals flash caution. The failed breakout suggests weak hands are cashing out, while volume trends hint at fading hype. But don't count Floki out yet—memecoins have a habit of defying gravity (and common sense).
Meanwhile, 'serious investors' watching this drama unfold are busy pretending they never bought dog-themed tokens during the 2024 bull run. Some things never change.

Floki dropped 6.74% over the past 24 hours and is currently trading NEAR $0.0001234. The price action shows a clear pattern of lower highs, suggesting that bullish momentum has weakened.
This decline follows a failed recovery above the $0.0001300 zone, with volume fading throughout the session. Despite this bearish structure, analysts remain divided on FLOKI’s trajectory, with some highlighting short-term recovery setups and others pointing to a longer-term bullish cycle.
This article explores the current FLOKI Price trend using insights from analysts @Tryrexcrypto and @Wgist2. It examines short-term risk-reward setups, volume behavior, and multi-year Elliott Wave targets that suggest a potential 10x upside.
Floki Price Faces Resistance After Breakdown From Ascending Base
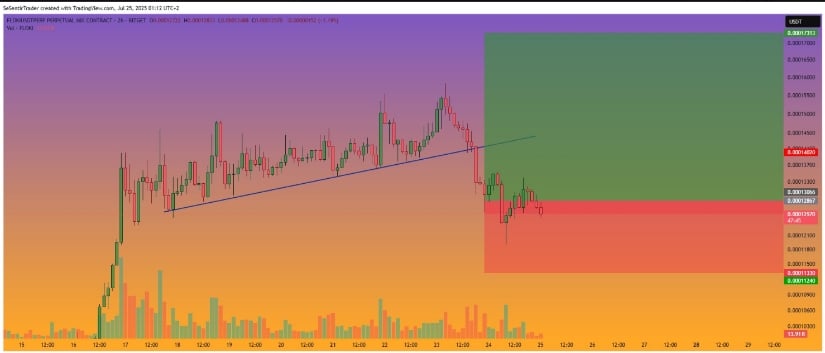
Floki price action has recently come under pressure after a clear breakdown below its short-term ascending trendline. The token, which had been trading within a rising structure for several sessions, fell through key intraday support between $0.00013066 and $0.00012867. The breakdown sent FLOKI price as low as $0.00011240, creating a new local range and testing previous demand zones.
Analyst Tryrex shared a 2-hour chart setup that captures this move. The breakdown invalidated the immediate bullish base and pushed the FLOKI price into a predefined red risk zone.
Source:X
Although the recovery target remains set at $0.00017313, with a stop slightly below $0.00011330. Although price action has not rebounded fully, the setup reflects an ongoing risk-reward scenario contingent on market recovery above the broken trendline.
Lower Timeframe Trends Show Bearish Pressure
Volume data shows no panic sell-off during the breakdown, but short-term momentum has shifted in favor of sellers. FLOKI has traded in a compressed range below former support since the drop, with no confirmed reclaim of the broken ascending trendline. Traders now watch to see if the token can reclaim the $0.00012800 resistance level.
The current technical structure shows a lower high formation forming just beneath the prior base. With multiple failed attempts to break back into the previous range, the probability of continued sideways action or further downside remains unless fresh buying interest increases. The analyst maintains a hold position while awaiting a break back above the trendline to reestablish upward momentum.
Long-Term Chart Points to Wave-Based Expansion
Despite the short-term correction, a longer-term perspective remains intact, as shared by analyst crypto Peer. The Elliott Wave count on the monthly chart shows FLOKI Price transitioning from a corrective ABC phase into a new five-wave bullish cycle. According to this structure, the token is now entering wave (3), which typically produces the strongest upward move in wave theory.

Source:X
The projected wave (5) price target sits at approximately $0.00152415, based on the 4.236 Fibonacci extension from the last major swing low. Previous waves have consistently bounced from a long-term ascending trendline, which has held since 2022.
Momentum readings on the lower panel of the chart indicate the beginning of a stronger MOVE if current support levels are maintained. The analyst suggests continued trend-following, with reassessment only if the multi-year trendline is violated.
Daily Performance Confirms Weak Short-Term Structure
The 24-hour chart for FLOKI reflects a 6.74% drop, bringing its trading price to around $0.0001234. This decline follows a failure to hold above the $0.00013000 mark and shows short-term selling pressure that outweighed buying attempts. Each upward movement met with rejection, forming a series of lower highs through the trading session.

Source: BraveNewCoin
Trading volume has declined compared to earlier activity on July 24, now stabilizing near $433.6 million. This reduction in momentum points to hesitance among buyers to reenter aggressively. FLOKI $1.19B market cap keeps it in focus, but a bullish reversal needs a break above $0.00012800 or a higher low above $0.00012000.
