🚀 BNB Price Surge: Binance Coin Shatters $738 Barrier—$2,000 Target in Sight for 2025

Binance Coin (BNB) just bulldozed past $738—and the bulls aren’t stopping there. With the $2K range now in play, traders are scrambling to position for what could be the next leg up in crypto’s relentless rally.
Why the frenzy? BNB’s breakout signals a potential rerun of its 2021 bull run, but this time with fewer memes and more institutional side-eye. The token’s defiance of gravity comes as Binance tightens its grip on the crypto economy—love it or hate it.
What’s next? If the momentum holds, we’re looking at a textbook Fibonacci extension toward $2,000. Just don’t ask the SEC for a blessing. (Because let’s face it—since when has crypto waited for permission?)
One cynical footnote: Wall Street’s still trying to mint ‘stablecoins’ while BNB laughs its way to the blockchain bank.

Market structure on the daily and monthly charts points to a possible breakout from a multi-year consolidation pattern. With trading volume steadily rising and accumulation underway, analysts are watching closely for confirmation of a structural shift.
At the time of writing, BNB holds above a key technical zone, sparking speculation over a MOVE toward the $2,000 range.
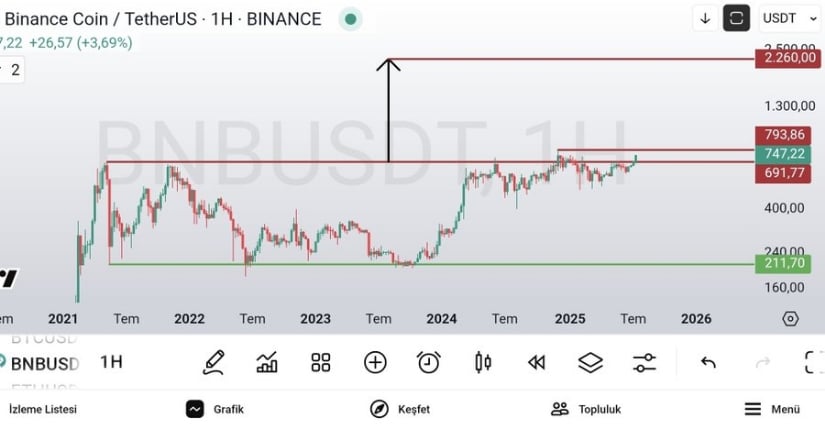
BNB Approaches Multi-Year Resistance Between $747 and $793
The long-term chart for BNB/USDT, presented by analyst Attila Olgun, outlines a horizontal resistance band between $747 and $793 that has held firm since mid-2021. This range previously capped multiple bullish attempts throughout 2021 and 2022, reinforcing its importance in the current trend.
BNB is now testing this upper boundary once again, with a recent price tag of $747.22 suggesting mounting pressure from buyers. Repeated retests over time indicate persistent upward momentum and growing bullish conviction.
Source: X
Support remains clearly defined at $211.70, which served as the foundation during BNB’s prolonged accumulation phase from 2022 to mid-2024. The horizontal range between $211.70 and $793.86 spans a wide consolidation zone, forming a technical setup often associated with eventual breakouts.
A measured move projection, based on the height of the channel, places BNB’s next potential upside target near $2,260. For this scenario to play out, the asset WOULD require a decisive weekly close above the upper boundary at $793.86 to confirm breakout strength.
Short-Term Surge Supported by Volume and Intraday Momentum
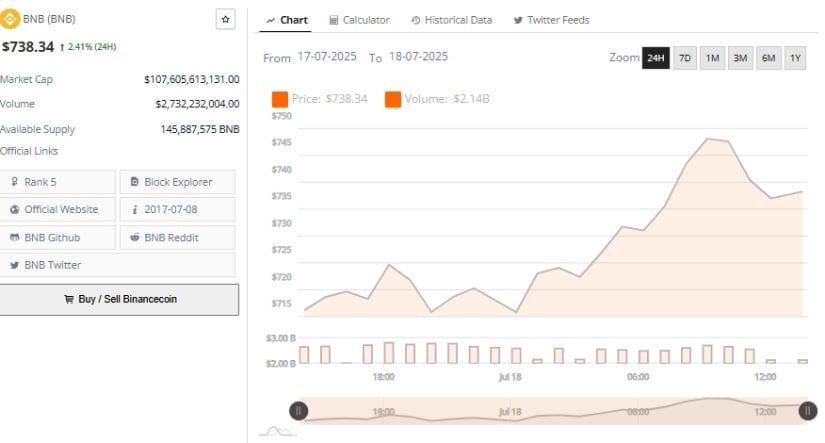
Data from BraveNewCoin shows that BNB experienced a 2.41% gain in the last 24 hours, climbing to $738.34 with trading volume reaching $2.73 billion. The price rally began NEAR the $712–$715 range and peaked close to $748 before a mild retracement.
Market capitalization currently stands at $107.6 billion, solidifying BNB’s position within the top five digital assets by total value. This short-term rally aligns with ongoing macro developments, as traders anticipate a potential breakout from the long-term resistance structure.
Source: BraveNewCoin
The volume surge between late July 17 and early July 18 marked the most significant momentum within the session. Increased participation was evident, particularly from institutional players, as volume bars ROSE alongside price. While some profit-taking appears to have occurred near the peak, consolidation above $730 remains firm.
This suggests that bullish pressure is still active and could extend into a renewed test of the $748–$793 range. A continuation of elevated volume may support a broader move toward the upper resistance threshold.
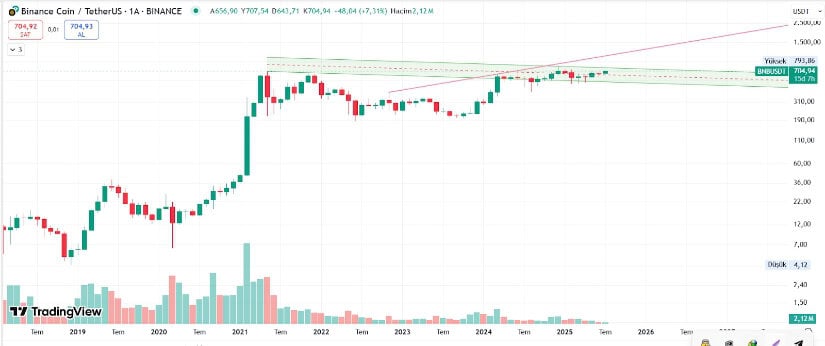
Wedge Breakout Pattern Emerges on Monthly Chart
Technical insight from analyst Borsaray (@borsaray) highlights a long-term bullish setup for BNB. The monthly chart displays a tightening wedge pattern, with resistance converging between $740 and $793.
The July candle, currently expanding in green, marks the latest in a series of attempts to breach the upper boundary. At the time of writing, BNB trades around $704.94, just beneath this long-observed resistance line, which dates back to early 2021.
Source: X
The chart structure suggests a volatility squeeze, typically followed by directional breakouts. Accumulation volume has remained steady across the past year, indicating that long-term buyers have continued to build positions in anticipation of a breakout.
If BNB closes the current month above $793.86, it would signal the first confirmed move outside the wedge structure. This could potentially usher in a new bullish phase, with Fibonacci projections and prior highs pointing to $1,500 and beyond as feasible future targets.
