Floki Primed for 20% Surge: Technicals Signal Bullish Breakout Ahead

Memecoin mania refuses to die—Floki’s charts now flash the clearest buy signal since its last parabolic rally.
The setup:
Three key indicators—all screaming upside. The 20% target isn’t hopeful speculation; it’s the minimum measured move if historical patterns hold (which, in crypto, they rarely do).
Why traders care:
Floki’s liquidity pools just hit a 90-day high while shorts get squeezed. Nothing fuels a memecoin pump like FOMO meeting forced buybacks.
The catch:
This isn’t investing—it’s gambling with better infographics. But for degenerates tracking the 4-hour RSI? That 20% might as well be etched in blockchain.

A recent move above key technical levels has pushed the token closer to a psychological resistance, hinting at a possible breakout. With both momentum indicators and trading volume aligning, FLOKI may be preparing for an extended move that could see it test multi-month highs.
Accumulation and Momentum Build Below Key Resistance
The 1-hour FLOKI/USDT chart displays a rising trendline with minor consolidation, currently guiding the price toward $0.000099. The structure suggests accumulation, with multiple instances of short-term pullbacks being absorbed by buyers.
Each retracement has resulted in renewed upward pressure, pushing the price incrementally higher while maintaining the short-term bullish channel. Price is now stabilizing above $0.0000969—a zone of significance as it coincides with the 200-day MA/EMA.
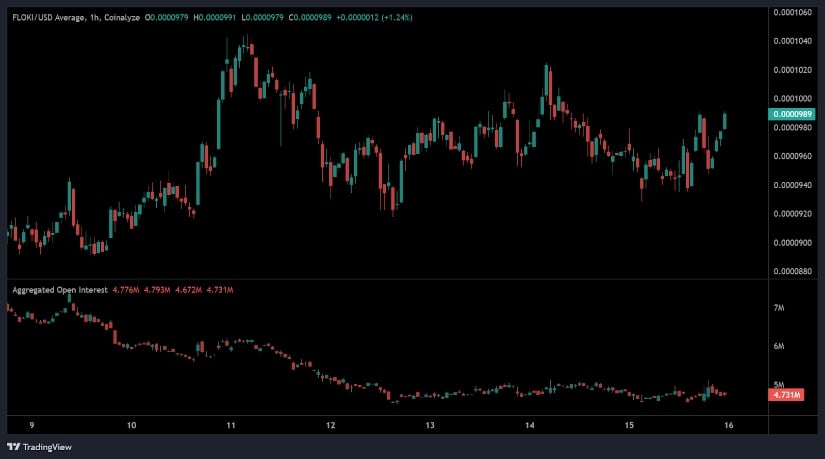
Source: Open Interest
Open interest data supports this bullish setup. Aggregated open interest has decreased slightly from 4.77 million to 4.73 million. Typically, a drop in open interest during a rising price scenario can suggest that speculative positions are exiting, possibly leading to a healthier, spot-driven rally.
This divergence between growing price action and falling OI signals that buying pressure may be coming from more stable holders rather than high-leverage traders. crypto analyst Traicy from TrackFi.ai noted FLOKI’s reclaim of the 200-day average as a critical bullish development, stating that momentum could accelerate if this level holds.
Rising Volume and Stable Market Cap Support Uptrend
FLOKI’s 24-hour chart reflects continued upside momentum, with a close at $0.00009888 after gaining 2.89%. Throughout the day, price action formed strong intraday lows and resisted multiple dips below $0.000094. Toward the session’s end, the token made a strong upward push, briefly touching $0.000099. This move positions FLOKI NEAR the $0.00010 psychological level—a potential inflection point for broader trend continuation.
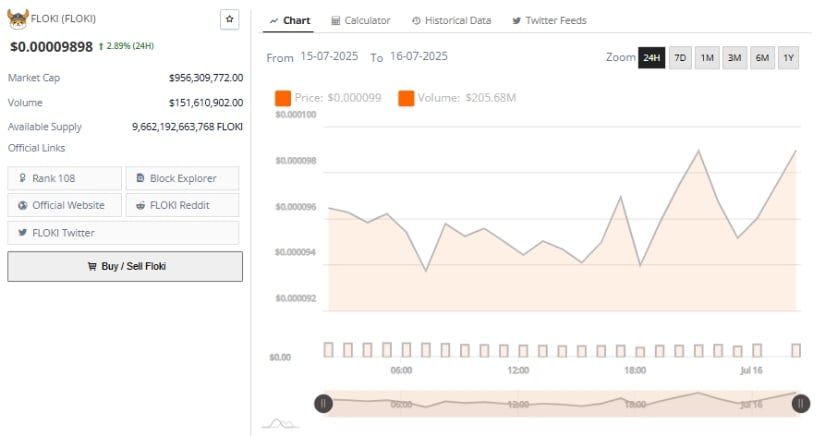
Source: BraveNewCoin
Volume provides additional confirmation. Over $205.68 million worth of FLOKI was traded in the last 24 hours, a significant increase that corresponds with the latest price rally. The consistency in volume suggests active accumulation rather than reactive trading, a sign that larger players may be positioning for a longer-term move.
With a market capitalization approaching $956.3 million and a circulating supply that remains stable, FLOKI continues to show resilience among mid-cap digital assets. If this momentum sustains, a break above $0.00010 could set the stage for testing resistance zones near $0.000012 and $0.000014.
Indicators Point to Continued Uptrend at the Time of Writing
At the time of writing, FLOKI trades around $0.00009883, marking a gain of over 2.5% on the daily timeframe. The price action confirms a breakout from the previous consolidation phase seen in early July, reinforced by consistently higher lows.
This upward structure aligns with a broader bullish continuation pattern and places the asset in a strong technical position as it approaches mid-term resistance.
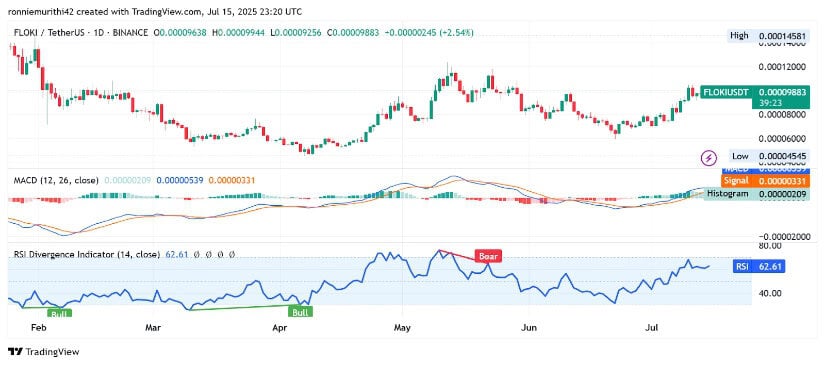
Source: TradingView
Momentum indicators further validate this structure. The MACD line has crossed above the signal line and continues to print green histogram bars, indicating strengthening bullish momentum. The RSI reads 62.61, firmly within bullish territory but not yet overbought, suggesting additional upside may be possible.
If current conditions hold, a 20% rally toward the $0.000012–$0.000014 range remains a viable near-term scenario. Conversely, a minor retracement could find support around the $0.00000900 level, previously a consolidation floor.
