BNB Breaks $700: RSI & MACD Signal Explosive Rally—$1,000 Target in Sight for Binance’s Powerhouse Token

Binance Coin isn’t just climbing—it’s bulldozing resistance. With a decisive flip past $700 and bullish confirmations from RSI and MACD, BNB’s chart screams ‘buy.’ Traders are already pricing in a multi-month sprint toward four digits.
### The Technical Fuel Behind the Fire
No fluke here. The Relative Strength Index (RSI) has rocketed into overbought territory—classic FOMO fuel. Meanwhile, the MACD histogram keeps widening, signaling accelerating momentum. Even crypto skeptics can’t ignore this setup.
### Wall Street’s Nightmare, Crypto’s Payday
While traditional markets obsess over Fed minutes, BNB holders are quietly stacking gains. The $1,000 psychological barrier looks increasingly like a pit stop, not a finish line. Just don’t tell the SEC—they’re still trying to define what a ‘token’ is.
### The Cynic’s Corner
Sure, fundamentals matter—until they don’t. Binance’s legal team works overtime while its native token laughs all the way to the blockchain. Sometimes, the best ‘use case’ is a green candle.

The price action is supported by surging volume, strong momentum signals, and structural chart breakouts confirmed by leading analysts. At the time of writing, BNB trades around $705, pushing toward reclaiming highs not seen since early 2024. Analysts point to a larger bullish structure forming on the daily chart, with macro targets beyond $1,000 now in focus.
Bullish Trade Setup Confirms Breakout Above $699
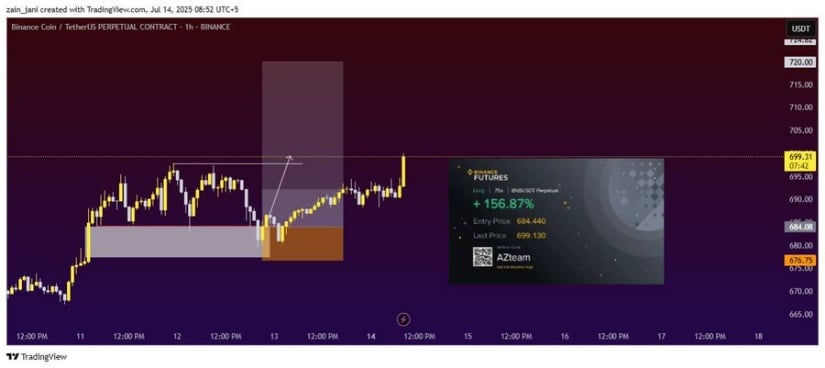
Bob Holthaus shared a long trade on the BNB/USDT Binance Perpetual 1-hour chart that entered around $684.44. The price formed an accumulation box before surging past the $690 resistance, hitting the first target at $699. This price movement followed a bullish continuation pattern supported by volume buildup and compressed price action. The reaction candle above $690 confirmed the breakout with a surge in trader participation.
Source: X
The trade management strategy included booking partial profits at the first target and moving the stop-loss to breakeven. The next resistance is expected NEAR the $720 region, though the trade already reflects a risk-managed gain. The entry and target zones were clearly defined, supporting disciplined trading approaches based on consolidation breakouts. Volume confirmation during the breakout validates the setup’s strength.
High-Volume Participation Pushes Price Beyond Psychological Barrier
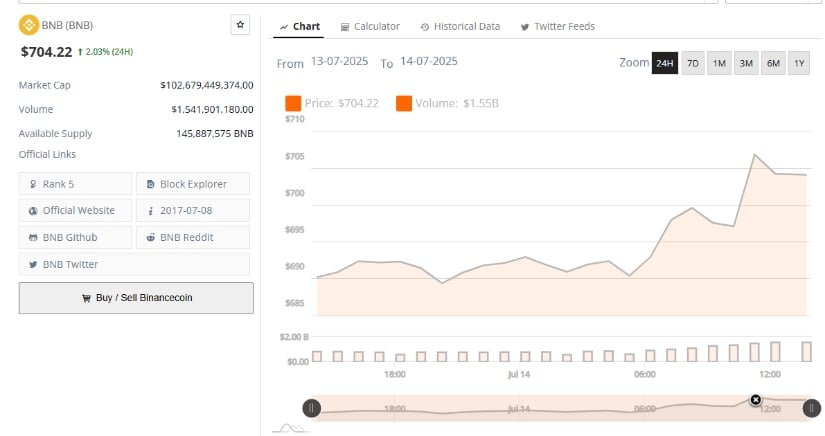
Additionally, BraveNewCoin’s 24-hour price chart of BNB reveals a 2.03% gain, lifting the token to $704.22. The session began with consolidation near $685 before a swift breakout above $695 initiated a sharp upward move. This bullish surge was accompanied by a 24-hour trading volume of $1.55 billion, indicating strong interest from retail and institutional market participants. The accumulation phase transitioning into breakout aligns with previous price cycles.
Source: BraveNewCoin
BNB’s market cap has now surpassed $102.6 billion, reinforcing its rank as the fifth-largest cryptocurrency. The final hours of trading show minor consolidation above $704, suggesting that bulls are preparing for a follow-through move. Holding above the $700 level is viewed as a short-term psychological win, often followed by attempts to retest multi-month highs if volume and sentiment persist.
Technical Indicators Strengthen Bullish Outlook Toward $1,000
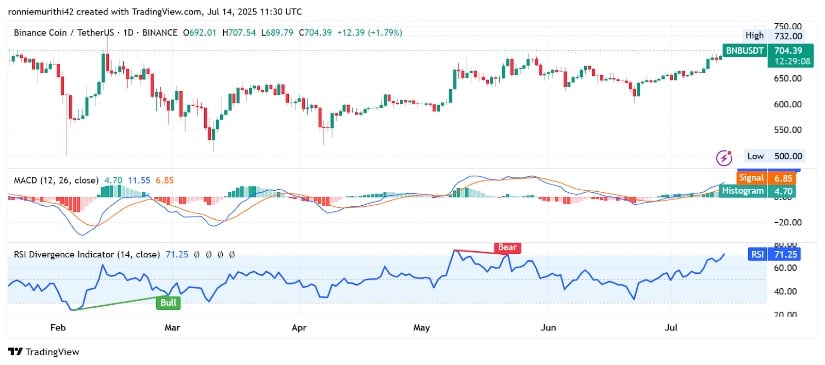
On the other hand, TradingView’s daily chart shows BNB rising 1.91% to reach $705.23, forming another higher high within an ascending trend. The price has broken above the $700 mark for the first time in over four months. Momentum indicators continue to strengthen: the MACD line remains well above the signal line, with a widening histogram at 4.76. The RSI stands at 71.49, indicating strong momentum but not yet signaling exhaustion.
Source: TradingView
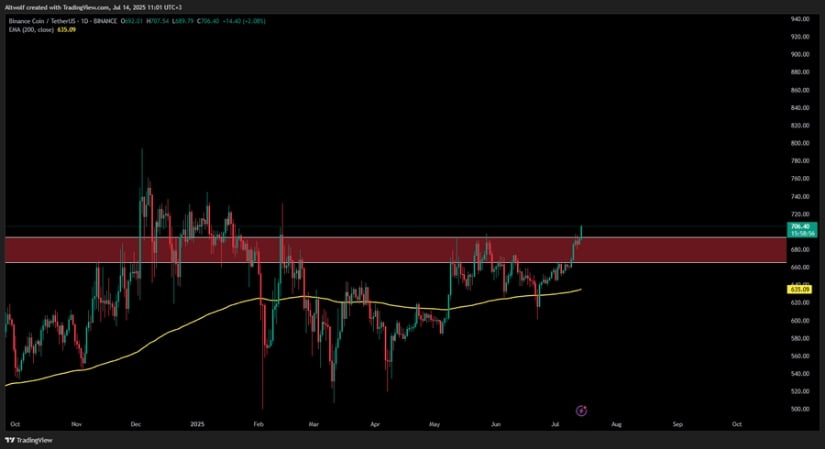
At the time of writing, the BNB/USDT chart shared by AltWolf confirms a breakout above a long-standing resistance zone between $660 and $700. The red-shaded area, which acted as a major supply zone since late 2023, has now been reclaimed. The current candle has closed above this resistance with a full-bodied breakout, ending the sequence of lower highs. The 200-day EMA, located at $635, served as dynamic support leading into this breakout.
Source: X
AltWolf highlights that BNB’s consistently higher lows reflect prolonged accumulation. With the breakout confirmed, the analyst sets a potential macro target near $1,000. This projection aligns with psychological round-number resistance levels and past rally structures in BNB’s history. If the current trend sustains above $700, BNB may enter a new multi-month rally phase supported by strong indicator alignment and favorable market conditions.
