Optimism (OP) Battles $0.66 Resistance: Can Bulls Finally Break Through?

Optimism's OP token hits a wall at $0.66—bulls charge but can't crack the ceiling. Here's why this level matters.
The $0.66 resistance isn't just a number—it's a psychological barrier that's turned into a battleground. Every failed breakout attempt drains momentum from buyers.
Meanwhile, traders whisper about 'the big move' while checking their portfolios for the 47th time today. Classic crypto: all hype until the charts say otherwise.
Watch this space. Either OP punches through or gets rejected hard. No in-between.

While some indicators suggest strengthening fundamentals, bulls have yet to flip key levels into support. Market participants are closely watching whether OP can maintain its footing above $0.64 amid rising volatility.
Bearish Setup Forms as Price Rejects Key Resistance
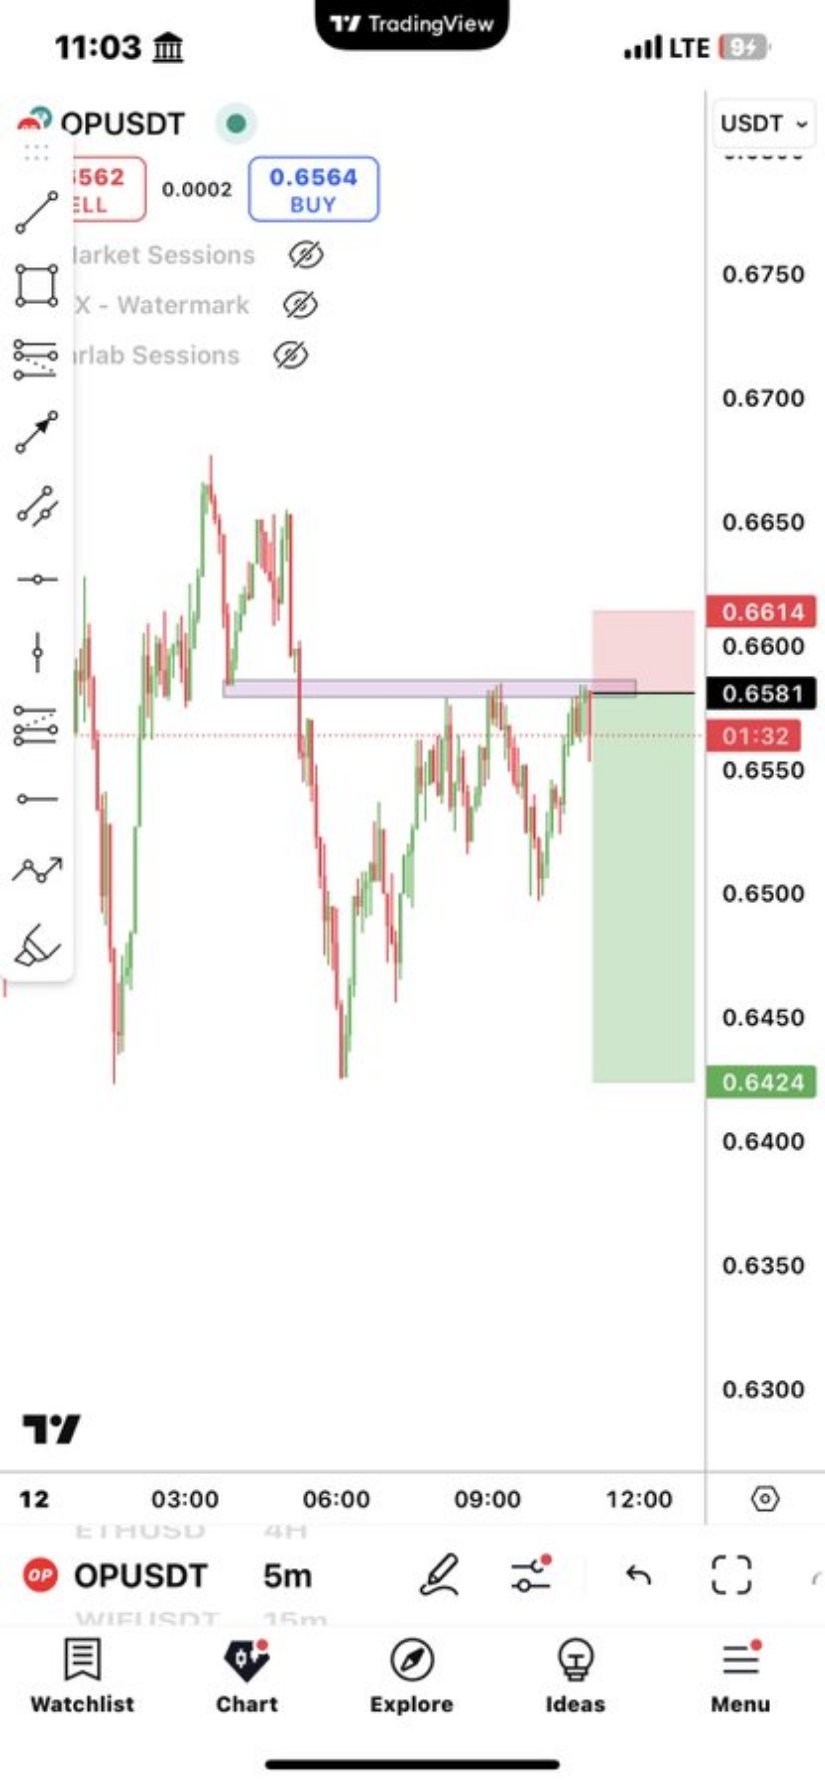
The OPUS/USDT 5-minute chart, shared by analyst @JeremyofCrypto, shows a defined short-term resistance between $0.6581 and $0.6614. This supply zone has seen repeated price rejections, weakening the bullish structure as traders defend this level.
A short position was identified just below $0.6581, with a conservative stop-loss above the resistance ceiling at $0.6614. This tight setup suggests a cautious approach amid repeated rejection at the overhead barrier.
Source: X
The price target for this short trade is set at $0.6424, NEAR a prior swing low. This zone has previously attracted buying interest, making it a logical level for profit-taking. As the price continues to test resistance without breaking higher, short-term bearish bias is gaining traction. The formation of a red risk zone above the entry underscores the trader’s focus on defined parameters and structured risk-reward management.
Consolidation Persists Amidst Steady Volume and Market Cap Stability
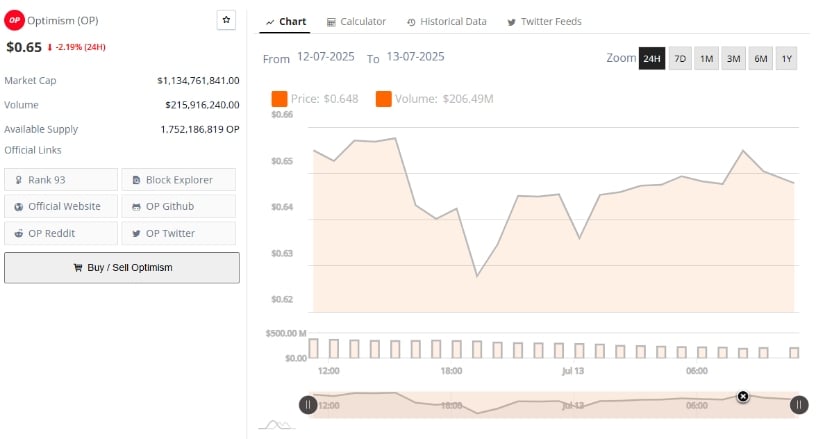
BraveNewCoin data highlights a 24-hour price range between $0.62 and $0.66, with OP last trading at $0.65, marking a 2.19% daily loss. The asset briefly touched $0.658 before retreating toward $0.64, forming a pattern of lower highs.
Despite some intra-session recoveries, the overall trajectory reflects hesitation near upper resistance bands. Volume remained consistent throughout the period, with the session’s high reaching $206.49 million, suggesting active but cautious market participation.
Source: BraveNewCoin
With a circulating supply of 1.75 billion tokens and a diluted market cap of approximately $1.13 billion, OP ranks #93 among digital assets by market capitalization. The supply profile and stable trading volume indicate continued engagement from traders, though not strong enough to trigger a sustained breakout.
Unless OP convincingly flips the $0.66 level into support, price action may remain range-bound between $0.63 and $0.66.
Daily Chart Indicators Signal Tentative Recovery
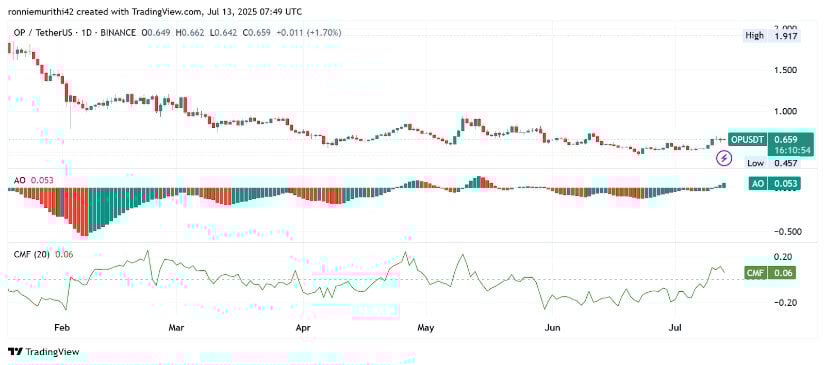
On TradingView, the OPUS/USDT daily chart reflects a modest recovery from previous lows, with price recently closing at $0.659 after bottoming out at $0.457 earlier in the cycle. The chart shows a gradual buildup in bullish candles since late June, with $0.60 acting as a visible accumulation zone. Resistance near $0.67 has emerged as the next technical barrier, historically functioning as both support and resistance.
Source: TradingView
Momentum indicators present a cautiously optimistic picture. The Awesome Oscillator (AO) has flipped green, posting a value of 0.053, indicating increasing positive momentum. At the same time, the Chaikin Money FLOW (CMF) stands at +0.06, confirming capital inflow after several weeks of outflow. These readings suggest that sentiment is improving, but further gains depend on OP closing above the $0.67 threshold with solid volume support.
While short-term setups remain mixed, the broader trend for OP hinges on its ability to overcome the current resistance structure and confirm bullish continuation.
