🚀 Dogwifhat Price Surge: Bullish MACD Crossover Targets $1.20 Breakout in July 2025

Dogwifhat (WIF) is flashing its strongest bullish signal in months as a MACD crossover sparks trader frenzy. The meme coin—once dismissed as just another dog-themed gamble—now has charts pointing to a potential 30% surge.
Technical breakout or hype cycle? Here’s what the data says.
MACD Green Lights the Rally
The moving average convergence divergence indicator just triggered a golden cross on the 4-hour chart. Historically, this pattern precedes double-digit gains for WIF—especially when volume picks up.
$1.20: The Make-or-Break Zone
That resistance level hasn’t been touched since the last crypto bull run. But with leveraged longs piling in, liquidity pools suggest a breakout could turn violent fast. Just don’t tell the 'fundamentals' crowd.
One cynical take? Traders are betting the Fed’s next rate cut will send degenerates back to meme coins—because nothing says 'risk-on' like a token named after a dog in a hat.

The token is showing resilience after a brief retracement, as buying pressure stabilizes it NEAR $0.96. With open interest holding steady and technical signals aligning, traders are watching for a decisive move above the key $1.00 level.
Price Structure Signals Short-Term Resilience
On the 1-hour chart from Open Interest, WIF displayed a notable rally from the $0.83–$0.85 accumulation range to a session high above $1.08. This upward momentum, which began on July 9, was driven by aggressive buying interest, visible in the large bullish candles and elevated trading volume. However, resistance emerged at the $1.05–$1.08 level, leading to a retracement back toward $0.96.
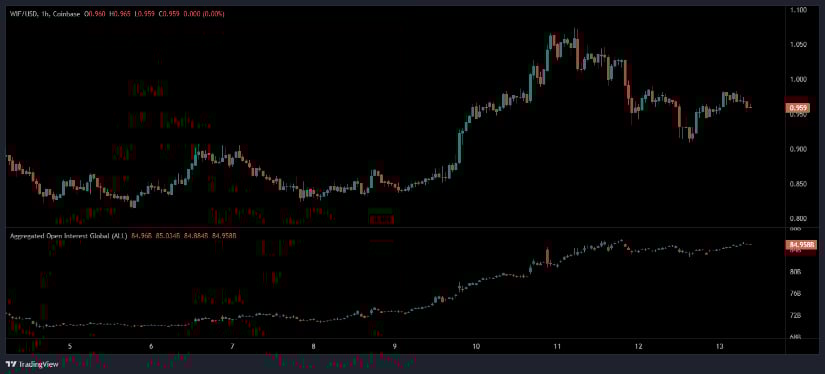
Source: Open Interest
Following the pullback, the price established a series of lower highs but found support near the $0.90–$0.93 zone. This level has since acted as a critical buffer, preventing deeper declines. Price is consolidating around $0.96 as the market awaits a potential breakout. The structure suggests that bulls may be building strength below the $1.00 mark, setting the stage for renewed upside momentum if that level is breached.
The open interest chart below the price action reveals sustained speculative participation. Open interest ROSE steadily throughout the rally and peaked in alignment with the price high. The absence of significant unwinding during the recent retracement suggests that market participants are still positioned for a potential upside continuation. A renewed increase in open interest coupled with price strength above $1.00 could confirm a continuation of the upward trend.
WIF Holds Ground Despite Volatility
Additionally, BraveNewCoin’s 24-hour performance data shows WIF trading at $0.96, reflecting a 1.51% decrease. Price fell as low as $0.91 before recovering to its current range, supported by consistent buying activity. The intraday volume totaled $348.38 million, indicating ongoing engagement from short-term traders and larger holders. This liquidity helped WIF defend key levels even amid minor corrections.
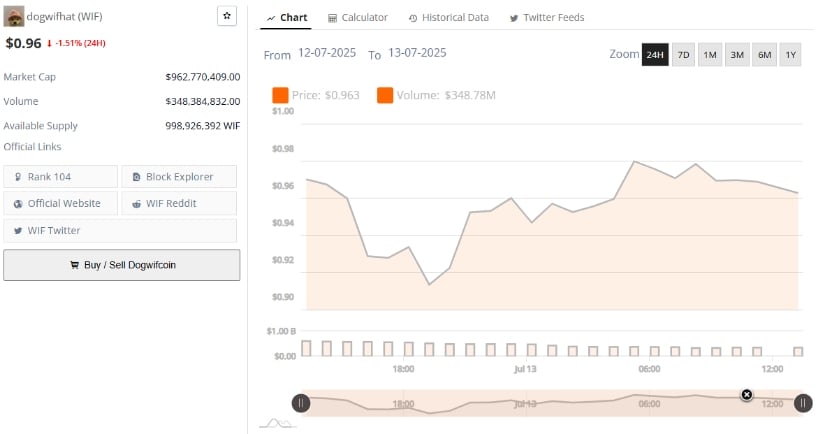
Source: BraveNewCoin
The market capitalization currently stands at approximately $962.77 million, maintaining WIF’s position among the top 110 tokens by market value. This stabilization reflects moderate investor confidence as the asset hovers just under the psychological $1 threshold. The $0.91–$0.93 zone remains a key level to watch in case of further pullbacks, while a breakout above $1.00 WOULD open potential moves toward $1.20 or higher.
Short-term price action shows several upward wicks, indicating pressure from sellers near resistance, but each dip has been met with renewed buying. The ongoing battle between support and resistance is forming a tight trading channel, typically a precursor to larger directional moves. A decisive push beyond the upper bound of this range would signal a shift in market control.
Momentum Indicators Support Bullish Bias
On the daily chart, WIF has transitioned out of its May–June consolidation range of $0.75–$0.90. The current price of $0.965 is supported by a strengthening MACD indicator, which shows a positive crossover. The MACD line is at 0.031 while the signal line is at 0.015, and the histogram remains in the green. This suggests early bullish momentum, backed by steady price structure and minor pullbacks.
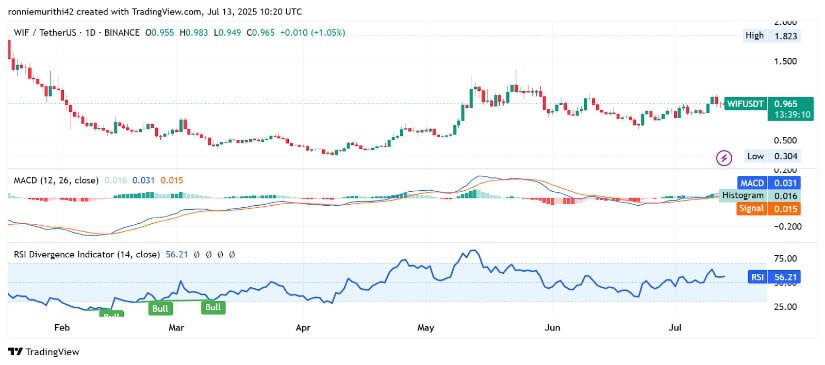
Source: TradingView
The Relative Strength Index (RSI) has climbed to 56.21, positioning WIF in a neutral-to-bullish stance. This reading indicates room for further upward movement before any signs of overbought conditions appear.
The RSI trend has moved higher since June, building on past divergence signals that previously anticipated upward reversals. These momentum indicators, in conjunction with a rising price base, strengthen the case for a MOVE beyond the $1.00 level if supported by continued volume and sentiment.
