BNB Price Surges Toward $733: Bulls Eye Monumental Breakout Ahead

BNB isn't just climbing—it's gunning for a knockout. The crypto's relentless push toward $733 has traders whispering 'breakout' like Wall Street brokers at a free-bar conference.
Momentum builds as bulls stack bids
Every resistance level crumples faster than a crypto startup's compliance docs. The $733 target? Just a pit stop—the real play's the psychological barrier beyond.
Chartists are sweating over their trendlines
Those Fibonacci retracements better be accurate, because retail's piling in like this is 2021 again. Liquidity pools thicken beneath the key level—smart money's building a launchpad.
Here's the kicker: nobody's selling
Exchange reserves are drier than a banker's sense of humor. Whether this holds or not? Depends if the 'greater fools' theory still holds water in 2025's regulatory circus.

Technical analysts are now closely monitoring a potential breakout that could shift market dynamics, especially as BNB continues to FORM bullish patterns supported by stable trading volume just under $800 million. Analyst insights suggest BNB is mirroring historic bullish structures, such as Gold’s pre-breakout triangle formation, and may be gearing up for a major rally toward $733 or even $1,000.
With an ascending triangle forming on the chart and momentum building gradually, BNB’s price action could soon confirm this bullish setup, positioning the coin for its next leg upward if current resistance levels are breached with volume support.
BNB Price Builds Momentum Toward $733 as Bulls Target Major Breakout Level
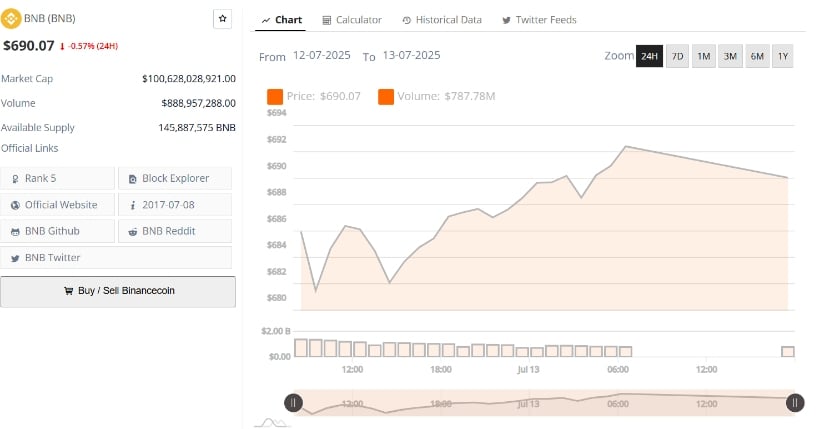
Binance Coin (BNB) Price closed at $690.07 on July 13 after peaking at $692 earlier in the day. The token had climbed from a base of $684, recording a measured ascent throughout the previous 24 hours. Binance Price increase reflected a gradual build-up in buying pressure before it saw a minor retracement from intraday highs. Despite this, the 24-hour change remained marginal, showing a -0.57% decrease.
Source:BraveNewCoin
The volume during this window stayed relatively stable, with daily turnover around $787.78 million. The Binance price movement formed a higher low and higher high within the timeframe, suggesting that the short-term structure remained bullish. With the market cap holding above $100 billion and BNB ranked fifth overall in market capitalization, the current trading setup remains under close watch for a continuation toward the $733 level.
Technical Structure Targets Breakout at $699
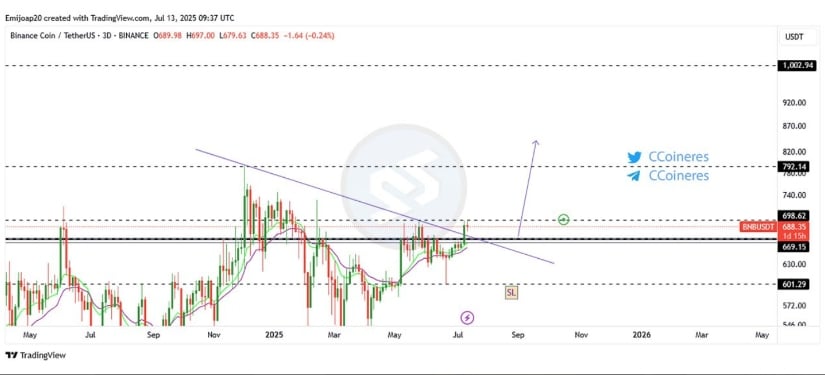
Analyst Emijaop.Turbo noted that the $699 level has become a critical inflection point for BNB Price. According to the analyst, each time the price breaks this mark, they plan to add to their position, which underlines its importance as a technical and psychological threshold. The level has served as a top boundary in previous rallies, but current momentum suggests growing attempts to challenge it.
Source:X
This resistance point also coincides with a longer-term ascending structure forming across multiple weeks. The $699 zone aligns with the upper boundary of a horizontal resistance line and intersects with a rising diagonal trendline.
A successful breach of this convergence could serve as confirmation for a stronger upward push. Technical traders have increasingly monitored this breakout zone for cues on whether the broader trend remains intact.
Fractal Comparison Drawn Between BNB and Gold
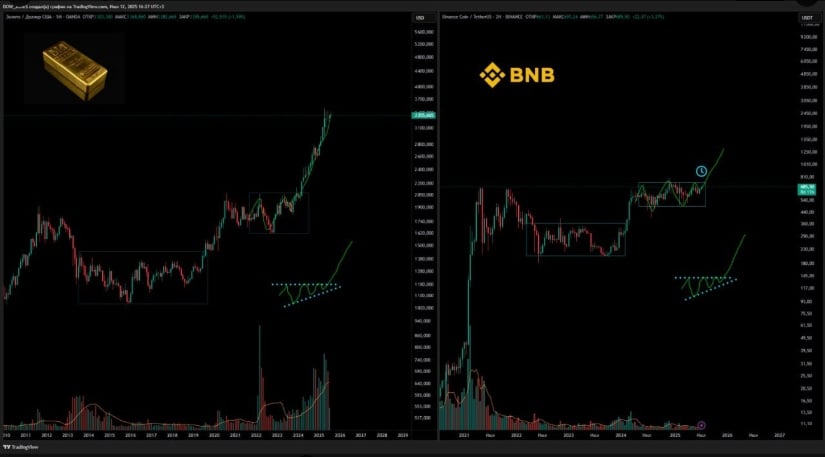
Another technical comparison shared by analyst Ludo Mun presents BNB’s chart structure alongside gold’s multi-year consolidation and breakout between 2013 and 2024. The Gold chart displayed a long consolidation phase, followed by a sharp upward breakout and continuation pattern.
BNB’s recent structure appears to mirror this, featuring prolonged accumulation, a breakout into an uptrend, and a developing ascending triangle.
Source:X
The symmetry observed in this chart comparison suggests that BNB is forming a similar continuation setup NEAR its current resistance band. The triangle pattern has taken shape just beneath the $700–$710 zone, an area of recent congestion.
The similarity to gold’s historical breakout pattern provides a visual reference that technical traders may use to anticipate future movement. If the ascending triangle resolves to the upside, BNB could enter a faster phase of price expansion.
Market Watchers Eye $733 if $699 Breaks
The next key level in focus is $733, which many traders consider the short-term price target if BNB price clears $699 convincingly. A breakout with increased volume above $699 may signal broader market participation and institutional entry. This could create a supply-demand imbalance, favoring upward movement toward higher resistance levels.
BNB Price has shown resilience in recent weeks, supported by stable market cap figures and gradual volume increases. If the current ascending triangle structure plays out as expected, and the $699 ceiling is crossed, BNB could enter a new rally phase. Market participants are closely observing these zones to assess whether the price confirms continuation or returns to a consolidation range.
