🚀 Bitcoin (BTC) Eyes $127.6K: RSI & ETF Inflows Fuel the Next Bull Run

Bitcoin's charging toward $127,600—and this isn't just hopium. The RSI's screaming bullish, ETF inflows are stacking like Wall Street's lunch orders, and the charts look like a rocket launchpad.
Here's why the skeptics might eat their words (again).
RSI Says 'Buy the Dip'
Bitcoin's Relative Strength Index broke past key resistance—no overbought alarms yet. Traders are flipping from 'wait-and-see' to 'FOMO' mode fast.
ETF Money Printer Goes Brrr
Spot Bitcoin ETFs just vacuumed up another $1.2B this week. Guess even boomer funds want a slice before the halving FOMO really kicks in.
Charting the Path to Six Figures
That $127.6K target? It's not some moonboy meme—technical analysts see clear momentum breaking historical resistance levels. Short sellers are getting squeezed harder than a lemon in a margarita.
*Cynical finance jab*: Meanwhile, gold ETFs are bleeding out like a Boomer's AOL stock portfolio.
Buckle up. This train's leaving the station—with or without you.

As bullish signals intensify, analysts are turning their attention to higher price targets for the world’s leading cryptocurrency.
Bitcoin Price Today: Bullish Momentum Drives BTC Toward New Milestone
Bitcoin is once again in the spotlight as it hovers around $117,900, up nearly 8% this week. The rally has been fueled by a mix of bullish chart patterns, favorable macroeconomic conditions, and surging institutional interest. With RSI readings above 75 and continued inflows into spot Bitcoin ETFs, the momentum could push Bitcoin beyond $120K, with $127.6K now emerging as a realistic near-term target.
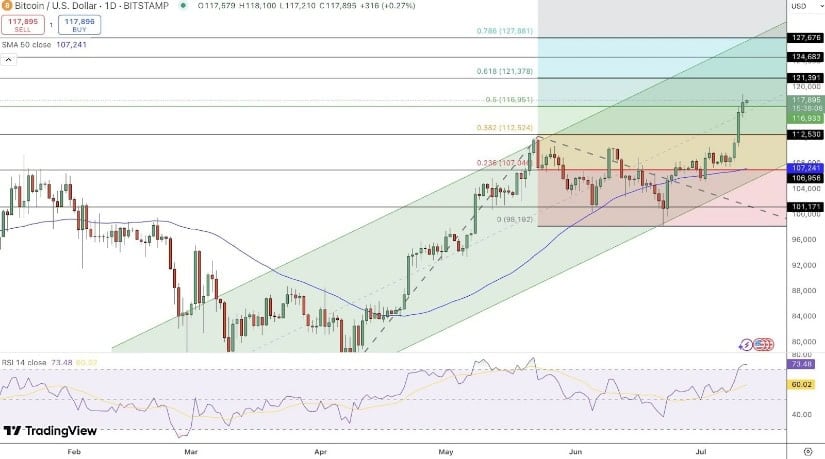
Bitcoin remains strong above $117K, supported by bullish RSI and key technical levels, with targets set at $121.3K, $124.6K, and $127.6K. Source: @forex_arslan via X
Meanwhile, the U.S. dollar’s recent weakness is driving investors to seek alternative stores of value. The WSJ Dollar Index has dipped to 94.73, down over 10% from its 2022 peak. As the dollar slumps, capital is flowing into bitcoin as a hedge against both inflation and central bank uncertainty.
Market Overview: Bitcoin Technical Analysis Signals Breakout Potential
From a technical standpoint, Bitcoin has broken out of a symmetrical triangle, clearing the 0.382 and 0.5 Fibonacci retracement levels with strong follow-through. The digital asset is now consolidating above $117K, with critical support from the 50-period simple moving average (SMA) resting around $110,527.
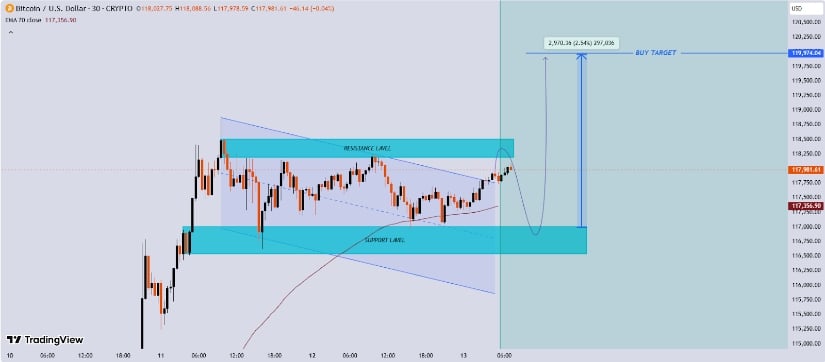
Bitcoin is trading within a defined range, with a potential bullish reversal setup forming NEAR $117,000 support, targeting $119,974 if the EMA 70 support holds. Source: Jameshead007 on TradingView
The Relative Strength Index (RSI) currently stands at 75.5, signaling an overbought market, but with no immediate bearish divergence. This suggests the uptrend may continue unless a reversal candlestick or decline in volume emerges. The Fibonacci extension level at 1.618 points to $120K–$127.6K as the next area of interest.
Technical data from TradingView and CryptoQuant reinforce this bullish outlook. Notably, a 2021 study found that RSI readings above 70 often precede significant price movements in crypto. In addition, Fibonacci retracement zones have historically acted as accurate support markers in 61% of Bitcoin’s bull phases since 2017.
Bitcoin Halving 2025, ETF Hype & Whale Activity Fuel Bullish Outlook
Beyond charts, macro forces and emerging trends are aligning to support higher Bitcoin prices. The Federal Reserve remains divided on interest rate policy, keeping markets in a state of suspense. Some officials are pushing for more tightening, while others hint at possible rate cuts. This uncertainty is driving risk-on sentiment in crypto markets.
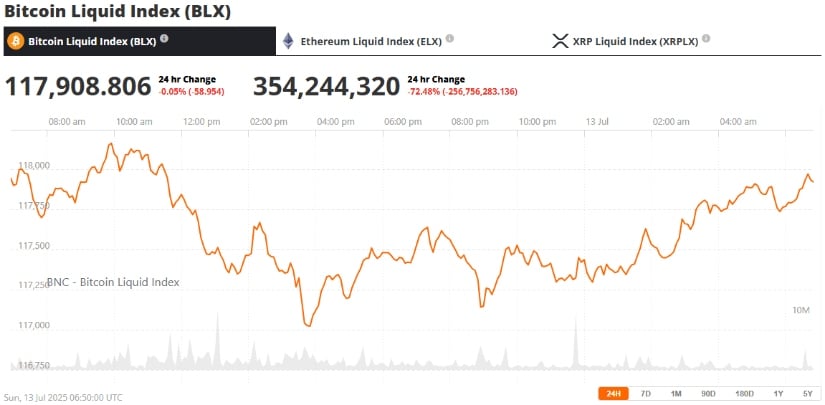
Bitcoin (BTC) was trading at around $117,908 at press time. Source: Bitcoin Liquid Index (BLX) via Brave New Coin
At the same time, Bitcoin ETF news continues to play a critical role. Despite delays surrounding Grayscale’s Digital Large Cap ETF, analysts expect more spot ETF approvals in the coming months, which could bring fresh institutional liquidity.
Adding to this momentum is a spike in whale activity and long-term holder conviction. On-chain metrics show major transactions over $100K increasing, while spot exchanges see declining BTC reserves—both signs of accumulation.
Looking further ahead, long-term projections see Bitcoin possibly reaching $300,000 by the end of the cycle, though conservative targets of $160K remain more plausible within 2025.
Bitcoin Long-Term Outlook: What’s the Next Move?
The Bitcoin price prediction landscape is becoming increasingly optimistic, with analysts seeing $120K–$127.6K as near-term targets. The ongoing rally has defied seasonal patterns, suggesting that Bitcoin may now be operating under a fundamentally different investment regime driven by ETF adoption and macro trends.
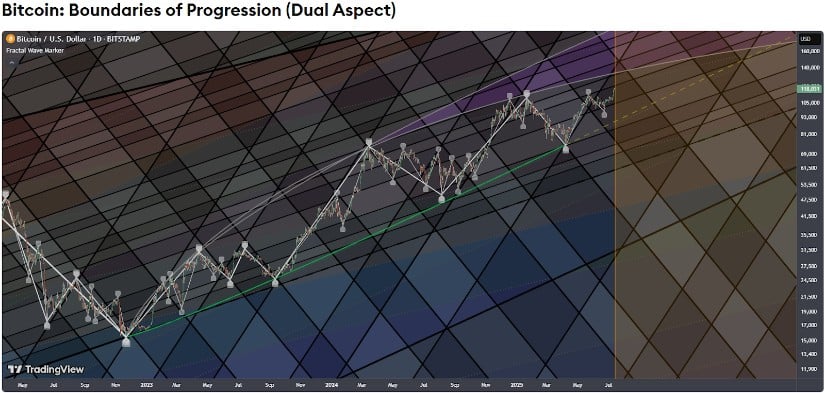
BTC/USD analysis highlighting key levels and blending short-term momentum with long-term trends to map potential breakout paths. Source: Fract on TradingView
While a short-term correction is not off the table, the broader outlook favors continued upside. With Bitcoin entering price discovery mode, investors are eyeing $127.6K as the next psychological resistance—and possibly a stepping stone toward the next major peak in the bull cycle.
As the market evolves, all eyes remain on Bitcoin to guide the trajectory of the broader crypto ecosystem. Whether it’s ETF momentum, RSI strength, or institutional positioning, BTC appears well-positioned for its next big move.
