🚀 OP Price Poised for Breakout: Bullish Divergence Targets $0.68 Surge

Optimism's native token flashes buy signals as technicals hint at an impending rally.
The Setup: A textbook bullish divergence on OP's daily chart suggests weakening selling pressure—just as Bitcoin stabilizes above $30K. Classic accumulation pattern.
Key Level: Watch the $0.68 resistance. A confirmed breakout could trigger algorithmic traders to pile in (because nothing fuels FOMO like machines chasing momentum).
Market Context: Layer 2 tokens outperformed ETH last quarter—though let's be honest, most 'fundamentals' in crypto are just narratives waiting for a liquidity tailwind.
Proceed with measured bullishness. These setups work until they don't—usually right after your leverage position opens.

After experiencing downward pressure through July, the token appears to be stabilizing above the $0.645 zone.
Momentum indicators across multiple timeframes now point toward a potential recovery phase, with analysts highlighting key price structures that could support an advance toward $0.68. A sustained breakout from current levels may establish a new short-term trend.
Short-Term Structure Shows Signs of Recovery
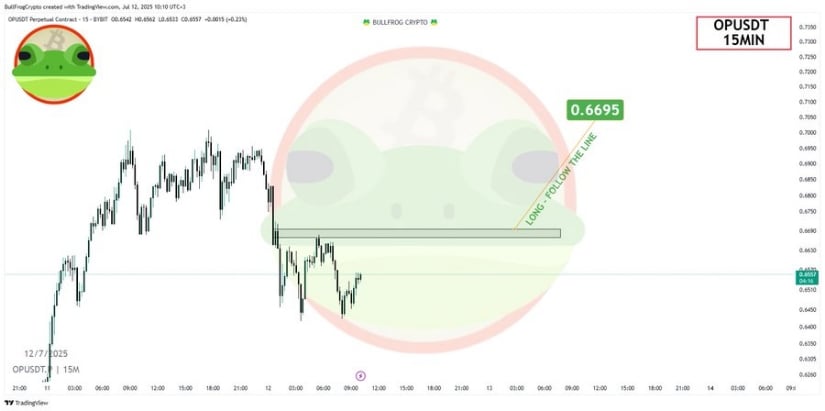
The 15-minute chart shared by BullFrog crypto indicates an emerging recovery attempt after OPUSDT fell below the $0.665 support. The chart shows a higher low forming, which suggests the beginning of renewed buyer interest.
Volume has also begun to stabilize, hinting that the recent selling pressure is weakening. A critical supply zone between $0.665 and $0.6695 remains the pivot point, and a successful reclaim could validate a continuation pattern.
Source: X
The visual path drawn on the chart points toward a short-term target of $0.6695. This level aligns with a previously broken resistance, now acting as a possible confirmation area for upside extension.
Traders are watching this zone for breakout and retest behavior, supported by volume increases. The strategy appears tailored to short-term scalping or momentum-based intraday entries, particularly if the consolidation holds above $0.650.
Bearish Intraday Pressure Followed by Recovery Effort
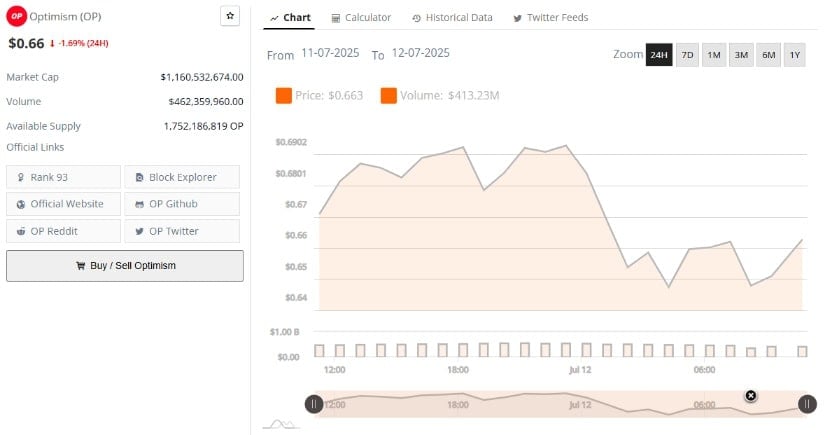
Additionally, according to BraveNewCoin’s 24-hour chart data, OP experienced a volatile session marked by both gains and losses. The token initially ROSE from $0.663 to nearly $0.6902 before reversing sharply.
The reversal, coupled with declining volume, suggested a lack of conviction in the earlier uptrend. Price eventually settled NEAR $0.66, closing with a 1.69% daily decline.
Source: BraveNewCoin
Trading volume for the period reached $462.36 million, indicating active participation throughout the trading cycle. While bears dominated the latter half of the day, the closing stages hinted at a mild bounce from the $0.645 support floor.
If the price can recover and maintain levels above $0.67, short-term sentiment may turn more constructive. However, confirmation is still needed for any breakout attempts above $0.68.
MACD and Bollinger Bands Hint at Momentum Shift
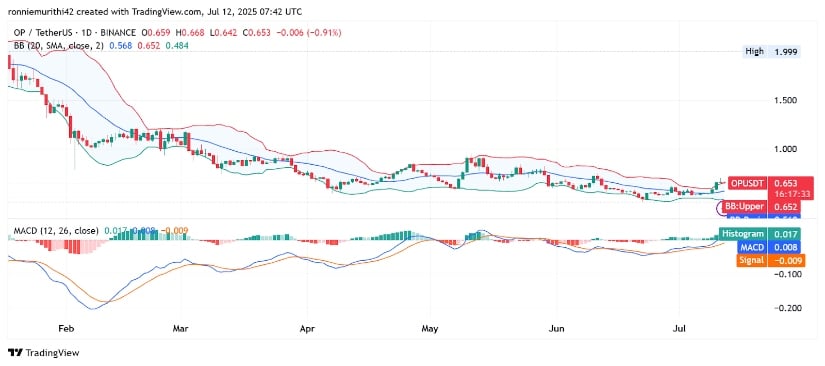
On the other hand, the daily chart for OP/USDT on TradingView presents a scenario of renewed bullish potential. Price action recently broke above the mid-Bollinger Band (20-day SMA), now trading at $0.653, while approaching the upper band at $0.652.
This positioning, paired with prior consolidation, suggests that the token could be entering a short-term breakout phase if it sustains above this volatility threshold.
Source: TradingView
The MACD indicator reinforces this view, with the MACD line (0.0187) crossing above the signal line (0.0162), and a positive histogram confirming upward momentum. The widening histogram bars further imply growing strength behind the move.
Historically, such crossovers within a Bollinger squeeze context have provided credible short-term signals. If buyers maintain momentum, OP could target resistance near $0.75 in the coming sessions, with the $0.568 mid-band serving as key support on any pullbacks.
Market participants will be closely monitoring how OP behaves around the $0.67 to $0.68 range. A confirmed breakout above these levels could signal the start of a broader recovery trend after months of compression and downward drift.
