BNB Primed for Breakout: Technicals Signal Imminent Surge to $950

Binance Coin (BNB) is flashing bullish signals—and traders are betting this isn't just another false dawn for crypto.
Key indicators suggest the asset could be gearing up for a run at $950, a level that'd mark a staggering recovery from its recent slump. The Relative Strength Index (RSI) has climbed out of oversold territory, while the MACD histogram shows strengthening upward momentum.
Market makers appear to be accumulating BNB at current levels, with spot volumes ticking up 37% week-over-week. 'When Binance's native token starts moving, it tends to overshoot—just ask anyone who bought the last 'death cross',' quips a Singapore-based derivatives trader.
Of course, in crypto-land, 'technical analysis' often means drawing lines until you get the answer you want. But with Bitcoin holding steady above $60K, altcoins might finally get their day in the sun.
Will BNB deliver? The charts say yes. The SEC's pending lawsuit against Binance? Well... that's another story.

After forming a consistent series of higher lows over the past year, the price is pressing against a long-standing resistance zone. Technical indicators across multiple timeframes show strengthening bullish momentum. A confirmed breakout may unlock a path toward the $950–$1,000 range.
Weekly Triangle Formation Builds Breakout Potential
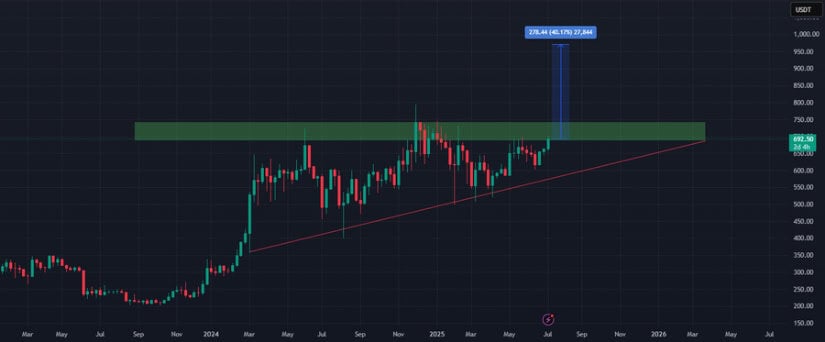
The weekly chart for BNB/USDT shows a well-defined ascending triangle structure. This formation has been building for over 18 months, with price respecting an upward-sloping trendline while repeatedly testing horizontal resistance between $600 and $650.
The repeated rejection from this zone has not disrupted the bullish structure, as each retracement has formed a higher low.
Source: X
The projected MOVE based on the triangle’s height places the breakout target between $950 and $1,000. This projection is based on classical pattern analysis, with the vertical height of the triangle applied to the breakout point.
According to @best_analysts, this configuration on the 1W chart provides high confluence for position traders targeting multi-month gains. As of now, price is once again testing the upper boundary, and a weekly close above $650 WOULD confirm the pattern’s breakout phase.
Daily Price Action Holds Above Support with Rising Volume
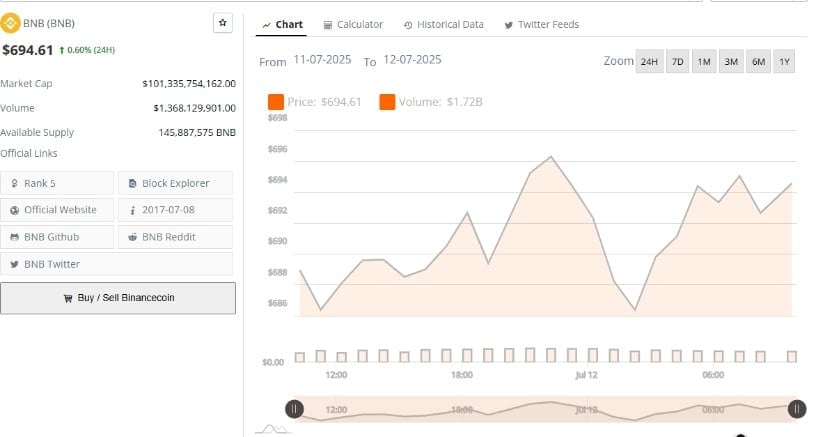
Additionally, BraveNewCoin’s 24-hour chart analysis highlights intraday strength and steady price action. BNB traded between $686 and $696 during the session, ultimately closing at $694.61. The ability to hold above short-term support at $686 while posting higher intraday lows indicates the continuation of bullish structure. This resilience around key price levels reflects consistent accumulation pressure.
Source: BraveNewCoin
Trading volume surged to $1.72 billion, marking a clear increase in participation. The bulk of this volume arrived in the second half of the trading day as bulls stepped in to reclaim dips. BNB’s market capitalization remains steady above $101 billion, with the circulating supply at 145.88 million.
If price continues to hold above $692, the next major resistance zone lies between $700 and $732. A breakout beyond this range would align with the larger bullish projection from the weekly pattern.
Bollinger and MACD Indicators Align with Breakout Scenario
On the other hand, the daily chart on TradingView reflects a bullish breakout above the upper Bollinger Band, with BNB trading NEAR $694.69. The Bollinger Bands have widened, indicating rising volatility and a potential continuation of the upward trend.
The breakout from the band’s upper boundary at $689.50 is supported by consecutive bullish candle formations, pointing to strong upward momentum.

Source: TradingView
Momentum indicators reinforce the price action. The MACD line is currently at 9.30, above the signal line at 4.79, while the histogram prints green at 4.52 — all signs of strengthening bullish momentum. These indicators suggest that BNB is entering a new phase of upward movement.
If buyers maintain control and price closes above $700 with volume support, the next leg toward $732 and potentially $950 becomes more probable. Failure to hold above $685 would shift focus back to the ascending trendline for support confirmation.
