Hedera (HBAR) Soars 12% in 24 Hours—Breaking $0.19 as Bulls Charge

HBAR defies crypto winter with a fiery 12% rally—smashing past $0.19 like a Wall Street intern smashing the espresso machine.
Price surge or dead cat bounce? Hedera's hashgraph tech keeps gaining enterprise traction, but let's see how long the momentum lasts before the usual 'profit-taking' (read: panic-selling) kicks in.
Meanwhile, traditional finance still can't decide if blockchain is the future or just a really elaborate Ponzi scheme. Place your bets.

Technical indicators and chart formations across multiple timeframes point to a potential mid-term shift in sentiment. At the time of writing, HBAR trades above $0.19, signaling strength after months of subdued performance.
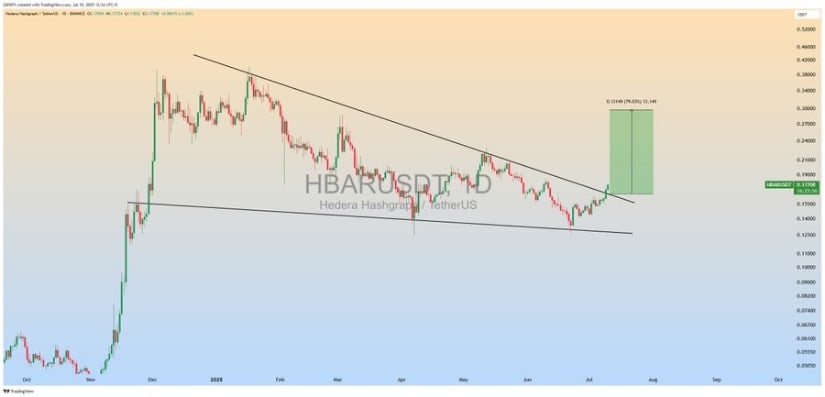
ZAYK Charts Signals Breakout From Descending Wedge
The daily HBAR/USDT chart published by ZAYK Charts (@ZAYKCharts) displays a clear breakout from a descending wedge pattern, which had formed through months of narrowing lower highs and lower lows.
The breakout above the upper trendline indicates that the asset has exited the compression zone with momentum. This technical pattern is often viewed as a bullish reversal, especially when accompanied by volume and market structure shifts.
Source: X
The analyst projects a measured target NEAR $0.31, representing an estimated 72% upside from the breakout level at $0.18. This target corresponds to the height of the wedge pattern extrapolated from the breakout point.
Currently, HBAR has cleared the wedge resistance and is holding above prior compression zones. Minor resistance levels lie at $0.22 and $0.26, but if the breakout structure remains intact, price action could continue toward the projected zone. Sustained volume and broader Layer-1 market interest are likely to support this momentum.
Buyers Reclaim Control as Volume Surges
According to BraveNewCoin’s 24-hour data, HBAR gained 12.42%, pushing from $0.17 to $0.193. The price broke above the psychological and structural resistance at $0.18, signaling a clean shift in control from sellers to buyers. Volume exceeded $387.93 million, with the majority of activity occurring as the token moved past the $0.18 mark—an area previously identified as a liquidity zone.
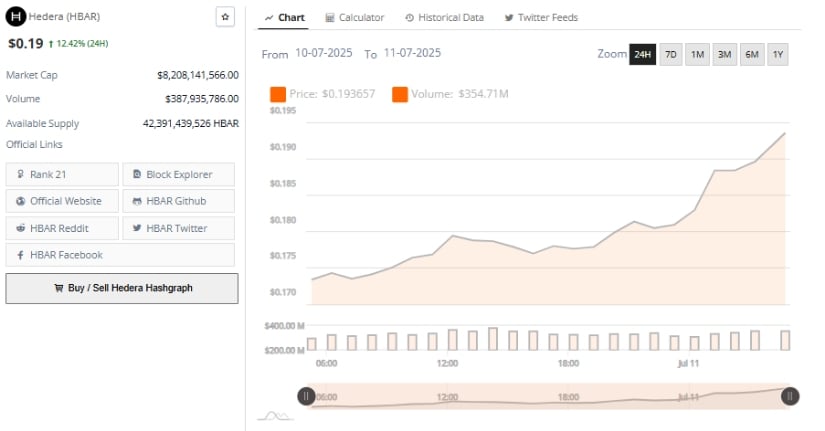
Source: BraveNewCoin
The market capitalization has crossed $8.2 billion, placing Hedera among the top 25 crypto assets. This rise in both price and trading volume reinforces that the rally is underpinned by strong participation rather than isolated spikes.
The circulating supply remains above 42 billion tokens, which provides enough liquidity for institutional and large-scale participants. Should the token hold above the $0.185–$0.190 level, the next resistance is projected between $0.20 and $0.22.
TradingView Indicators Validate Trend Reversal
Technical insights from TradingView show supportive momentum across lower timeframes. The 1-hour chart shared by Grovot crypto Alert Bot identifies a liquidity zone breakout around $0.17987.
After multiple rejections at this level, the price surged past it with a strong sequence of green candles, reaching a local high of $0.19017. This MOVE confirms that short-term resistance has been flipped into support.
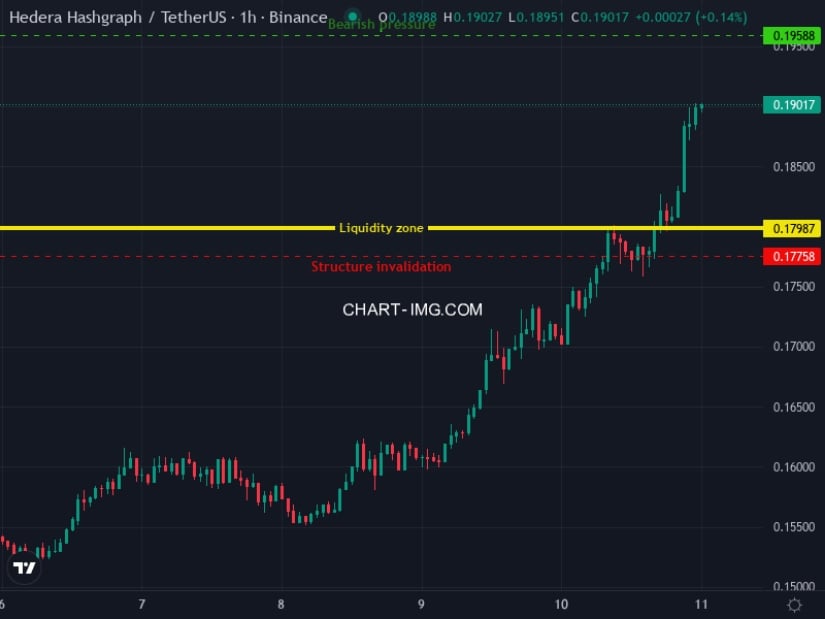
Source: X
The chart marks $0.19588 as the next immediate pressure zone, while $0.20 remains the broader psychological barrier. Continued strength above $0.17987 WOULD validate the breakout structure.
Price movement, supported by increasing volume and minimal retracements, indicates that bulls remain in control. For short-term confirmation, the market will watch for follow-through above $0.195 and consolidation above support zones before any further upward extension.
