Worldcoin Price Poised for Breakout: RSI at 43 and MACD Flip Hint at $0.86 Floor

Worldcoin's technicals are flashing green—quietly. The RSI hovering near 43 suggests exhaustion in recent selling pressure, while the MACD's bullish reversal whispers 'accumulation zone.'
Key levels to watch
That $0.86 support isn't just psychological—it's where the algos start buying. A hold here could trigger short-covering into resistance levels last seen before Sam Bankman-Fried pretended to understand risk management.
Why traders aren't celebrating yet
Volume remains anaemic. Until whale wallets wake up, this is a technician's playground—tight stops below $0.80, cautious targets at $1.10. Because nothing says 'stable base' like a cryptocurrency that mooned 300% then gave back half in a week.

Recent indicators suggest the asset may be forming a base after months of bearish movement. Market participants are closely watching for signals of a shift in momentum, with both volume and trend indicators hinting at a potential recovery phase. While resistance remains firm NEAR $0.90, technical indicators now point toward a period of reduced selling pressure.
Funding Rate Flip Highlights Trader Sentiment Shift
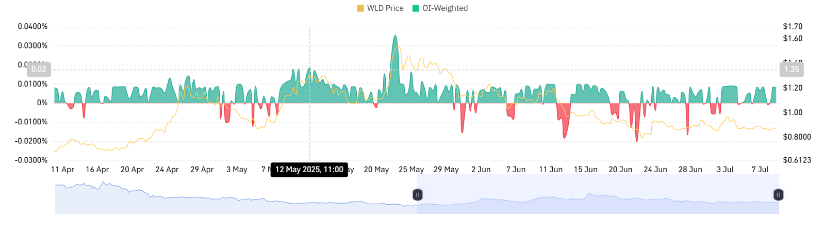
The correlation between WLD price and open interest-weighted funding rates shows a notable shift in market sentiment. During the early stages of the timeline, positive funding rates accompanied rising prices, indicating a strong long bias among leveraged traders.
This upward MOVE culminated in a sharp rally in mid-May 2025, pushing WLD toward a local high near $3.17. At that time, open interest and funding surged, signaling increased speculative activity and bullish conviction.
Source: Chart by Coinglass
However, this rally was short-lived. Funding rates quickly turned negative as the price reversed, indicating an abrupt unwind of long positions and heightened short-selling pressure. The reversal reflects a typical bull trap, where speculative Optimism was followed by widespread liquidations. In the weeks that followed, the price stabilized, and the funding rates fluctuated around neutral territory.
This pattern suggests a cooling market with less speculative activity and more balanced positioning. The blue indicator—representing volume or total open interest—also flattened, reinforcing the view of a low-volatility accumulation phase.
Market Activity Cools After Sharp Decline
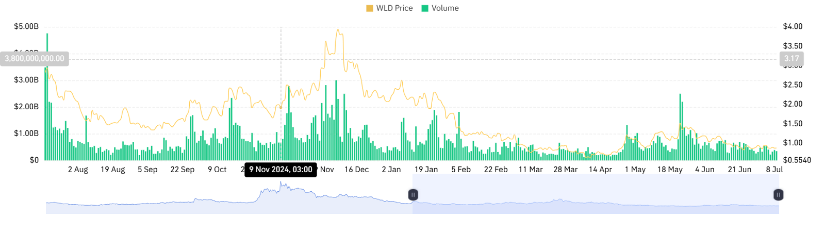
Data from BraveNewCoin reveals WLD’s broader trend from late 2024 through early 2025. Following the peak near $3.17, the token experienced a consistent decline characterized by lower highs and lower lows. Despite intermittent recovery efforts, such as the rebound in November 2024, volume failed to sustain any significant upward pressure.
This inability to maintain elevated activity levels reflected weakening buying conviction throughout the second half of the timeline.
Source: Chart by BraveNewCoin
By early 2025, WLD transitioned into a flatter range, with price volatility diminishing and volume declining. The downtrend evolved into horizontal price action, indicative of reduced speculative participation and a potential bottoming process. This stagnation often precedes a breakout event, particularly if accompanied by a volume resurgence.
Until that occurs, the market appears to be in a transitional phase, marked by trader caution and muted momentum.
RSI Stabilization and MACD Signal Potential Upside
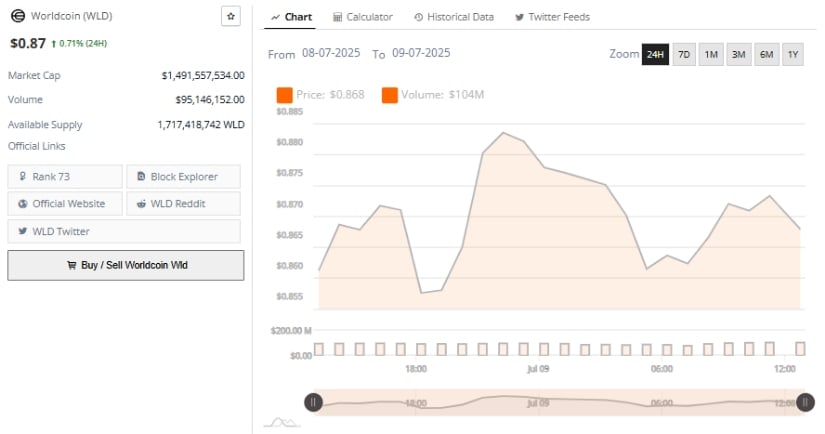
As of July 9, data from TradingView shows WLD/USDT trading at approximately $0.869. The daily chart reflects a sustained downtrend since the May highs, though recent candlesticks show signs of stabilization near the $0.860 support zone. The Relative Strength Index (RSI) reads 42.78, hovering below the neutral 50 level. The RSI-based moving average stands at 43.02, reinforcing the presence of sideways momentum rather than a defined directional bias.
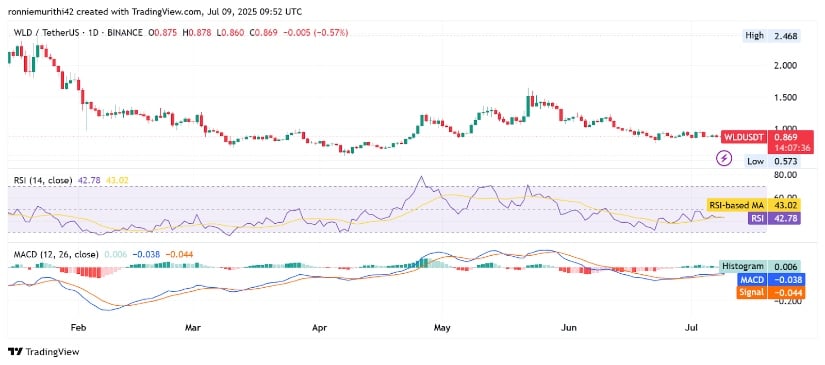
Source: Chart by TradingView
The MACD (Moving Average Convergence Divergence) provides an early indication of a possible reversal. The histogram has turned marginally positive at 0.006, and the MACD line is approaching the signal line. Though still close to the zero baseline, this subtle shift could imply fading bearish pressure.
For traders, a confirmed crossover along with expanding green bars in the histogram WOULD support a bullish scenario. Provided the price remains above $0.865 and volume begins to rise, WLD could make another attempt at breaking the $0.90 resistance band.
