Optimism (OP) Primed for $0.44 Plunge—Then a Violent Bull Run?

Layer 2 darling Optimism looks ready to bleed out before the bulls step in. Technicals scream 'fire sale' as OP teeters on the edge of a breakdown.
Blood in the Streets? Perfect.
Watch that $0.44 level like a hawk—if it cracks, weak hands will panic sell straight into the jaws of institutional buyers. Classic crypto rinse cycle.
Post-Dip Rocket Fuel
Every 80% drop in crypto history gets followed by a 300%+ dead cat bounce. OP's infrastructure dominance won't disappear because traders got spooked.
Just remember: Wall Street calls this 'price discovery.' You call it another Tuesday in DeFi.

Recent chart data indicates a consolidating structure within a bearish zone, suggesting limited buying strength. Momentum indicators reflect indecision, while price action continues to compress under critical resistance.
Traders are now closely observing the $0.44–$0.47 area as a potential inflection point in OP’s broader market trajectory.
Price Stalls Below Key Resistance After Breakout Failure
On the OP/USDT daily chart, the asset trades NEAR $0.54, below the well-defined resistance band between $0.573 and $0.652. This zone has consistently capped upside attempts, highlighting its importance as a major supply level.
Analysis from Finora AI identifies this range as a high-probability reversal area, especially when tested with weakening bullish momentum. Recent price activity shows multiple failed rallies into this zone, reinforcing its role as a technical ceiling.
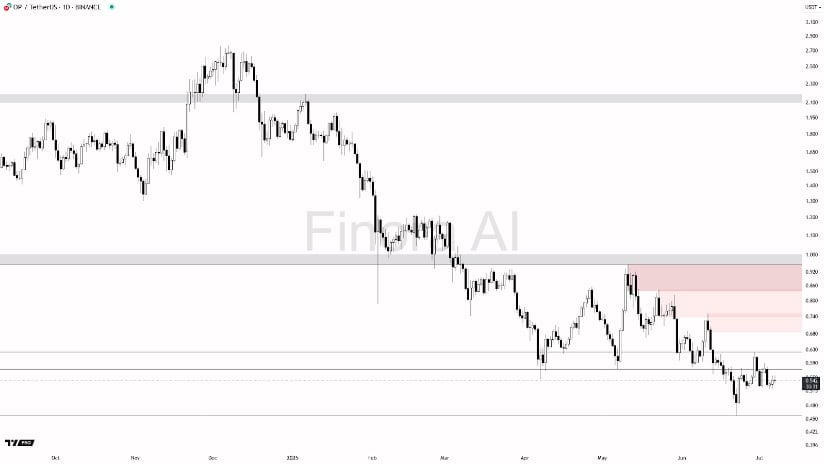
Source: Chart by Finora Ai X
Finora AI also outlines potential downside targets if rejection continues. A reversal from this resistance range could push OP toward previous support areas near $0.477 and $0.442. These levels have historically provided short-term relief and are being monitored as possible bounce points in the event of a breakdown. Indicators on lower timeframes, such as the 4-hour and 1-hour charts, may provide early confirmation through reversal candlestick patterns.
Unless OP clears $0.652 with strong volume, the path of least resistance appears tilted downward in the short term.
Volume Divergence Points to Continued WeaknessMarket data over the past 24 hours indicates a subdued bullish effort. Based on Brave New Coin statistics, OP opened the session near $0.54 but closed at $0.536 after reaching a brief high just above $0.548. The inability to sustain gains during this period reflects ongoing selling pressure. The token recorded a daily loss of 2.18%, extending its recent underperformance against broader market moves.
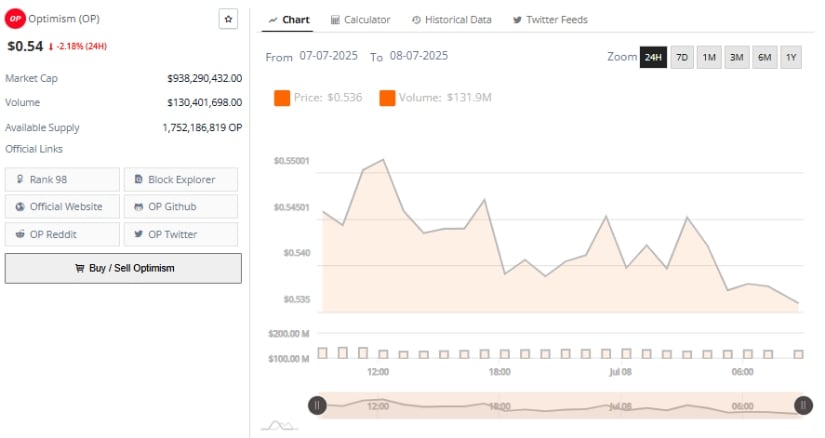
Source: Chart by Brave New Coin
Trading volume stood at $131.9 million, above average for OP but paired with declining price action. This divergence suggests distribution by market participants rather than accumulation. When volume increases while price drops, it typically implies that holders are selling into short-term strength. Such behavior tends to confirm bearish sentiment and reduces the likelihood of a near-term reversal unless momentum dynamics shift.
With a market capitalization of $938 million and a circulating supply of 1.75 billion tokens, OP remains a mid-tier asset. Its relatively high supply means that demand must remain consistent to support bullish price movement. The price zone around $0.55–$0.56 remains critical for bulls to reclaim. Without a convincing MOVE above this band, the likelihood of a slide into lower support territory increases.
Indicators Signal Extended Consolidation Phase
The daily chart shows OP maintaining a compressed range above $0.53, with limited volatility and a weak recovery setup. The Relative Strength Index (RSI) is at 44.46, slightly below its signal average of 44.80. This position highlights weak momentum, as RSI remains below the neutral 50 threshold. The RSI’s sideways movement over the past several weeks confirms that the market is still lacking directional conviction.
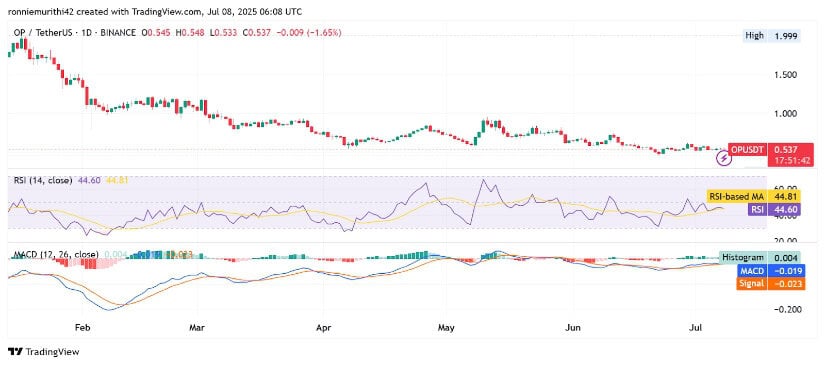
Source: Chart by TradingView
The Moving Average Convergence Divergence (MACD) also reflects indecision. With the MACD line at -0.019 and the signal line at -0.023, the proximity indicates an absence of trend dominance. A histogram reading of 0.004 further confirms that neither bulls nor bears are in full control.
Analysts note that a confirmed breakout above $0.60 WOULD require both a bullish MACD crossover and a sustained RSI move above 50. Until those conditions are met, OP may continue to test lower supports, with the $0.44 level becoming increasingly relevant as a possible rebound zone.
