Uniswap Primed for Breakout: Liquidity Surge Signals Bullish Momentum

DeFi's liquidity king flexes its muscles—Uniswap's deep pools set the stage for a potential price explosion.
Liquidity as rocket fuel
With TVL figures that'd make traditional exchanges blush, UNI's market depth could propel it past stubborn resistance levels. The DEX isn't just surviving the bear market—it's accumulating ammunition.
Technical setup screams opportunity
Chart patterns mirror early 2024's breakout formation, back when UNI defied 'expert' predictions and ripped 300% in 90 days. This time, the infrastructure's even stronger—though let's see if Wall Street 'advisors' still dismiss it as a 'fad'.
Make or break moment
Either Uniswap's about to validate its dominance with a textbook breakout, or we'll witness the most overcapitalized fakeout in DeFi history. Either way—grab popcorn.

Short-term charts suggest that bullish pressure is gradually building. Despite minor pullbacks, trading volume remains healthy, and indicators now show mixed but improving momentum. This environment has set the stage for a potential breakout, provided buyers defend current support levels.
Chart Shows Buyer Engagement Amid Pullback
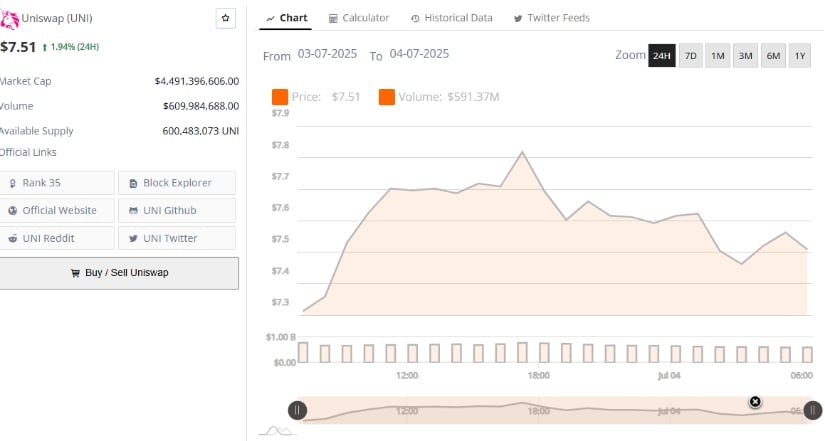
The 24-hour BraveNewCoin chart, covering July 3 to July 4, 2025, showed Uniswap starting the session near $7.20 before rising rapidly to a local peak of around $7.80. This intraday surge was driven by renewed market activity, pushing UNI to test short-term resistance just below $7.90.
However, the MOVE failed to sustain above that level. As profit-taking emerged, the token retraced to the $7.45–$7.50 zone, where support held through the remainder of the session.
Source: Brave New Coin
Despite the retreat, Uniswap closed the session at $7.51, marking a 1.94% gain. Volume remained relatively consistent throughout the correction phase, with $609.98 million in 24-hour trading volume.
This steadiness indicated a controlled environment rather than panic-driven selling. According to BraveNewCoin data, UNI’s circulating supply stood at 600.48 million tokens, placing its market cap at $4.49 billion. Its rank of 35 among crypto assets reflects continued investor interest and participation, even as price action enters consolidation.
If the $7.45 support level continues to hold, bulls could attempt another advance toward the $7.90 resistance. A successful break above this range may open the way for a broader move targeting the $8.50 region, though confirmation through volume expansion WOULD remain key.
Symmetrical Triangle Pattern Identified on 4-Hour Chart
In a recent update on X, technical analyst Crypto Bureau pointed to a symmetrical triangle pattern forming on the Uniswap (UNI/USDT) 4-hour chart. The structure consists of converging trendlines formed by lower highs and higher lows, signaling a period of compression ahead of a potential breakout.
At the time of writing, UNI was trading around $6.66 and nearing the triangle’s apex, suggesting that a directional move could follow soon.
![]()
Source: X
The accompanying volume trend during the pattern’s formation showed declining activity, which is typical in such setups. Analysts observed that a breakout above the upper boundary, especially with volume confirmation, could trigger a move toward $8.00 or higher.
This projection aligns with the measured move technique, which applies the triangle’s height to the breakout point. On the downside, if the price fails to close above the upper trendline, rejection could pull the token back toward the $6.00 support zone.
Momentum indicators, including the RSI, were neutral at the time of the pattern identification. This reflects a lack of strong directional bias, reinforcing the idea that a breakout or breakdown would provide the next major signal. Traders and market watchers are likely awaiting such confirmation before adjusting positioning.
Daily Indicators Reflect Mixed Momentum and Outflows
On the daily chart from TradingView dated July 4, 2025, Uniswap traded at $7.455, marking a minor dip of 0.27%. The candlestick formation continues to show resistance around $8.00, with repeated rejections over the past few weeks. Meanwhile, price has respected the $7.00 support level, forming a tight range that reflects ongoing market indecision.

Source: TradingView
Technical indicators show a split in momentum. The Awesome Oscillator (AO) registered a positive value of 0.246, suggesting mild upward strength, as green histogram bars reappeared following a short pullback.
However, the Chaikin Money FLOW (CMF) turned negative, printing a -0.11 value, indicating capital outflows. This divergence suggests that although some bullish momentum exists, buying pressure remains insufficient to drive a sustained breakout.
For Uniswap to break above its current range, positive confirmation across both AO and CMF would be needed. Until then, price is likely to oscillate between $7.00 and $8.00, with traders watching for a volume-supported breakout as the next catalyst.
