BNB Primed for Breakout: EMA Support & Surging Volume Signal $730 Rally Ahead

Binance Coin (BNB) is flashing bullish signals as technical indicators align for a potential surge. The cryptocurrency has found sturdy support at its exponential moving average (EMA) while trading volume spikes—classic fuel for an upward move.
Market watchers eye $730 as the next key resistance level, a price point that would mark a significant recovery from recent lows. If momentum holds, BNB could retest its all-time high (ATH) in the coming weeks.
Traders are piling in despite regulatory headwinds—because nothing screams 'healthy market' like ignoring warning signs in pursuit of gains. The volume surge suggests either smart money positioning or reckless FOMO, depending on who you ask.
With the EMA acting as a springboard and buyers stepping in aggressively, this looks like more than a dead-cat bounce. Whether it's the start of a sustained rally or just another crypto pump remains to be seen.

With technical indicators pointing upward and analysts identifying higher targets, BNB could be on track for a continued rise toward the $730 region.
Falling Wedge Breakout Signals Structural Shift
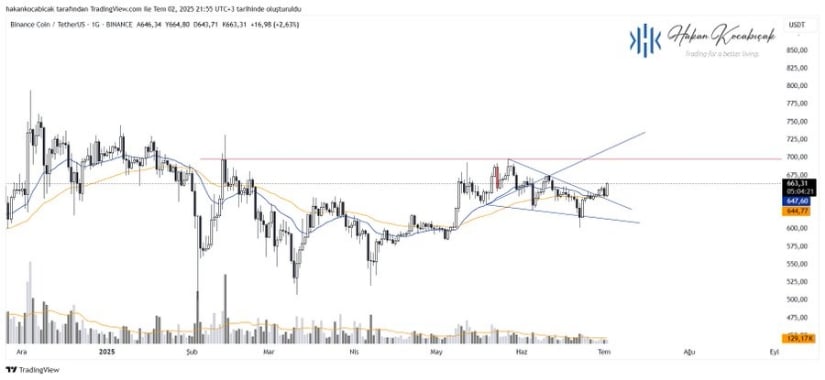
In a recent X post, analyst Hakan Kocabıçak shared a daily chart of BNB/USDT, identifying a decisive breakout from a falling wedge pattern. The token has gained 2.63% and is currently trading at $663.31.
This price movement is supported by strong candle volume, indicating conviction behind the breakout. The pattern had been forming during a multi-day downtrend, with BNB consistently creating higher lows—a structural sign of growing buyer strength.
Source: X
Technical analysis shows that BNB has successfully reclaimed the 50-day exponential moving average (EMA) NEAR $644, which had previously acted as resistance. The price is now tracking an upward-sloping channel established from May lows, with visible potential to reach the $700–$720 range.
Increased volume during the breakout adds further confirmation. The price behavior, coupled with consistently higher lows and rejection from lower trendlines, signals a positive structural shift favoring bulls. Swing traders are watching for a retest of the breakout area to establish new support.
Analyst Projections and Market Data Suggest Momentum is Building
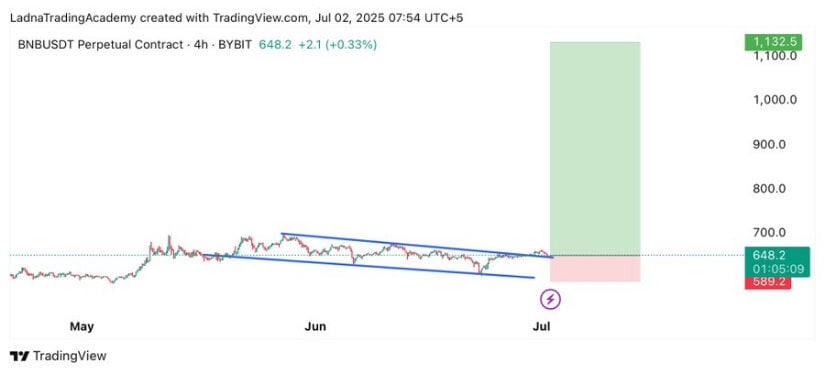
A separate insight from crypto analyst Bitunix supports the breakout thesis. In his recent X post, James noted that BNB had broken out of a bullish wedge on the 4-hour timeframe. These shorter-term breakouts can often lead to rapid short-term price movements.
Source: X
He commented, “Full send it if we do break out,” hinting at the possibility of continued upside. If BNB maintains momentum, it may soon test the psychological resistance at $700, with a path potentially extending toward $730 in the medium term.
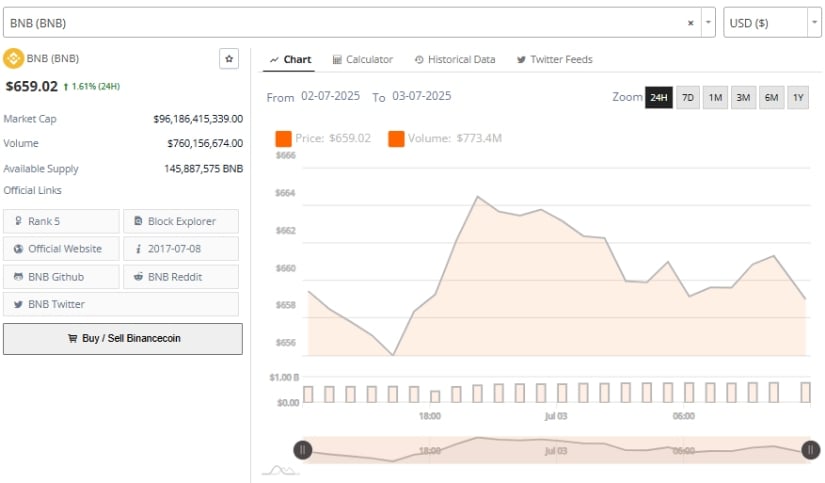
Data from Brave New Coin confirms these developments. As of the latest update, BNB is priced at $659.02, reflecting a 1.61% gain in the past 24 hours. The token holds a market capitalization of $96.18 billion, placing it firmly at rank #5 globally. Daily trading volume stands at $760.15 million, consistent with its recent activity range.
Source: Brave New Coin
The available circulating supply is 145.89 million BNB, with no major changes in issuance or burn affecting its liquidity. The continued integration of BNB within Binance’s suite of products and the growing use of the Binance Smart Chain contribute to the token’s underlying strength.
Binance Coin Price Prediction: Indicators Confirm Improving Technical Outlook
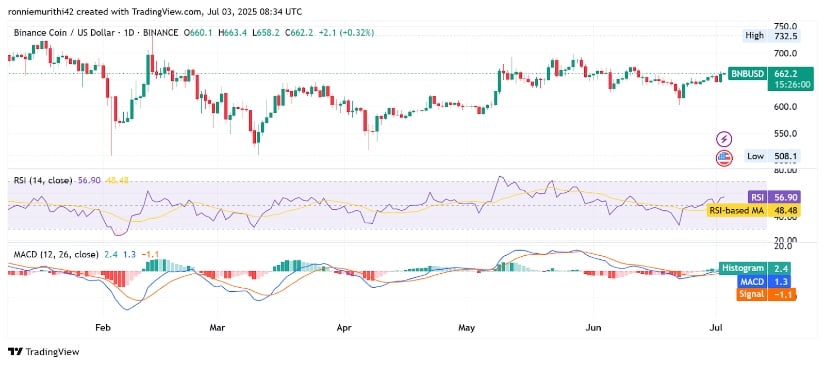
On the BNB/USDT daily chart, the token is trading at $662.80, up 0.41% on the day. Following a bounce from lows near $635, BNB is forming a series of higher lows while consolidating beneath the $670–$680 resistance zone. Price action suggests a recovery phase is underway, and the absence of significant upper wicks on recent candles indicates steady demand. If this momentum continues, the price could soon challenge upper-range resistance
Source: TradingView.
Momentum indicators support the improving outlook. The Relative Strength Index (RSI) has moved above 50 and is currently reading 57.17, with its moving average at 48.50. This indicates a shift into bullish territory, with room for further upside before the market becomes overbought. The MACD indicator also shows bullish divergence.
The MACD line is at 1.4, above the signal line at -1.1, with a histogram reading of 2.4. The increasing gap between the MACD and signal line reflects strengthening momentum. These indicators, combined with the recent breakout and volume surge, suggest BNB could retest prior highs around the $730 level if buying pressure continues.
