Floki Primed for Explosion: Triangle Breakout Signals 150% Rally Ahead

Floki isn't just barking—it's ready to sprint. A textbook triangular breakout pattern suggests this meme coin's next leg up could dwarf its previous pumps.
Technical traders are circling
The chart doesn't lie: symmetrical triangles like this historically precede violent moves. With volatility compressing to a coiled spring, Floki's 150% upside target isn't moonboy hopium—it's simple geometry.
Retail's favorite underdog
While 'serious' investors scoff at dog-themed tokens, Floki keeps dodging death spirals. Its relentless community and shameless marketing stunts (remember the UK football stadium takeover?) keep liquidity flowing where 'fundamental' plays stagnate.
Just don't mortgage your house
Yes, the pattern looks juicy. No, crypto isn't a get-rich-quick scheme—unless you're the VC who dumped their pre-mine on retail. Trade the setup, but maybe skip the leverage this time.

This setup, which mirrors previous macro cycles seen in similar meme-based tokens, could open the door to a rally targeting levels last seen during early 2024. With current price activity aligning NEAR accumulation zones, analysts are watching closely for breakout confirmation.
Elliott Wave Structure and Investor Roadmap
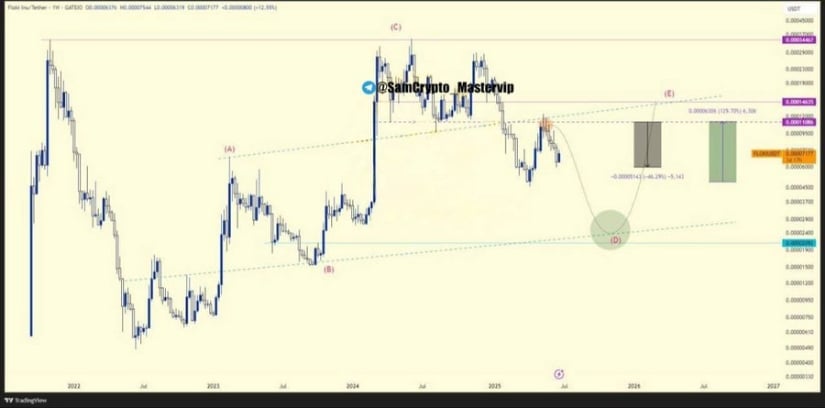
A widely followed analyst, crypto Master in X, has outlined a weekly chart that identifies a potential Elliott Wave pattern unfolding on the FLOKI/USDT pair. According to the structure, the token completed a five-wave rally that culminated with Wave (C), which peaked at the $0.000045 mark.
That zone is referred to as a resistance-heavy “danger zone,” where prices historically face increased profit-taking. Following this peak, FLOKI underwent a substantial drawdown of approximately 50%, entering a corrective structure that appears to be progressing toward a possible Wave (D) bottom.
Source: X
The analysis outlines that this corrective movement is forming within a downward channel, with the next key support zone located between $0.00001600 and $0.00001300. This region is highlighted as a reaccumulation zone, where buyers may begin stepping in again, completing the corrective leg and setting the stage for a potential Wave (E) reversal.
The forecast suggests that the upward wave, if realized, may revisit prior highs or come close, creating a setup for a 150% risk-to-reward MOVE from current levels. Strategic positioning in this lower band could offer long-term entry points for investors focusing on market structure rather than short-term volatility.
Floki Price Prediction: Recent Market Behavior and Volume Analysis
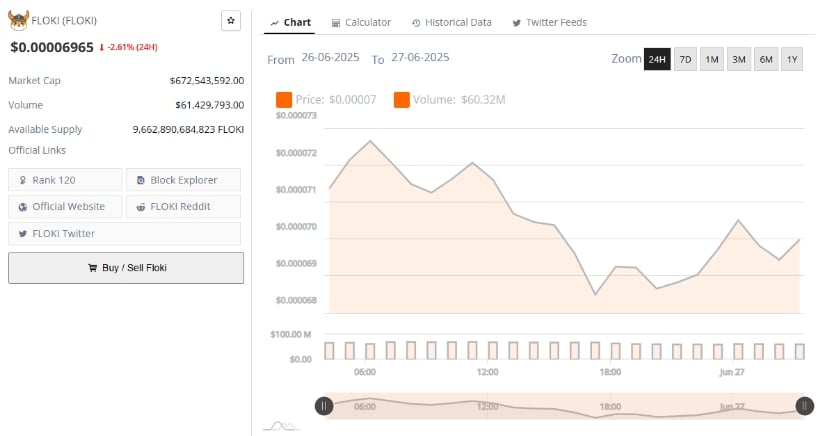
Additionally, data from the past 24 hours shows that floki price prediction is trading at $0.00006965, reflecting a daily decline of 2.61%. Price movement during the session has been confined to a narrow range between $0.000068 and $0.000072, reflecting subdued volatility.
Early intraday gains were short-lived, and the price slipped below key psychological thresholds such as $0.000070, suggesting persistent selling pressure and potential investor fatigue. The limited price action signals distribution activity, with no fresh bullish catalysts emerging to reverse the trend in the short term.
Source: Brave New Coin
The volume over the same period totaled approximately $61.42 million, against a market capitalization of $672.5 million. This results in a healthy volume-to-market cap ratio of about 9%, suggesting sufficient liquidity. However, the lack of significant price appreciation despite the robust trading activity may indicate that much of the volume is driven by sell orders rather than accumulation. This is supported by the volume histogram, which lacks any pronounced spikes, pointing to steady outflows rather than rapid repositioning. Such a dynamic suggests that participants are exercising caution and awaiting stronger confirmation before re-entering the market in significant numbers.
Technical Indicators Point Toward a Consolidation Phase
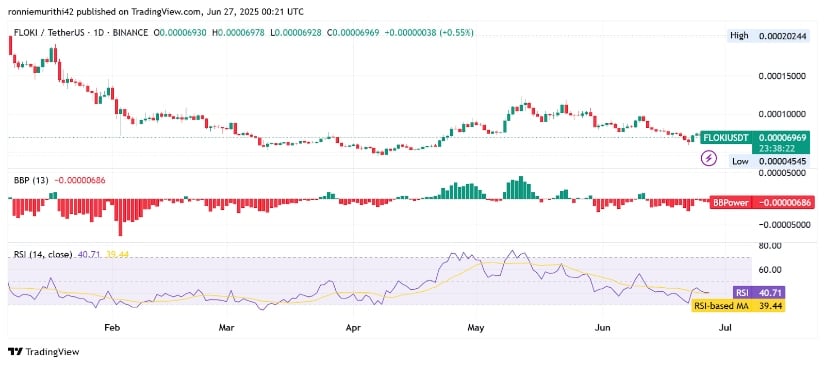
On the daily chart, FLOKI price prediction is trading near $0.00006969 as of June 27, with price action displaying signs of consolidation following a sustained downtrend from its May peak. The pattern of lower highs and lower lows has dominated for several weeks, but a recent green candle suggests the potential for a short-term bounce.
This move, while modest, may indicate an attempt to build a base above the prior low of $0.00004545. The formation of a triangle pattern is becoming more evident, with price coiling toward a possible breakout point in the sessions ahead.
Source: TradingView
Technical indicators provide additional context. The Balance of Power (BBPower) reading remains negative at -0.00000686, signaling continued bearish control, though the histogram has started to flatten. This development may suggest that the selling momentum is losing strength, but no clear trend reversal is yet confirmed. Traders often look for this histogram to turn green before positioning for a bullish move, as it indicates that demand is beginning to outpace supply.
The Relative Strength Index (RSI) currently reads 40.71, slightly above the oversold threshold but still within a low-momentum region. The RSI moving average sits at 39.44, and the narrowing gap between the two suggests a potential alignment.
If the RSI begins to trend upward and crosses the 50 level, it could serve as an early indicator of growing buying strength. Should FLOKI Price prediction hold current support and form a higher low, the triangular pattern may resolve to the upside, especially if accompanied by a spike in volume. Such a breakout could mark the beginning of a new bullish phase, targeting a return to higher resistance levels.
