Chainlink Price 2026: Slips to $14.28 as Multi-Year Support Holds - The Critical Line in the Sand

Chainlink's price finds itself at a familiar crossroads, testing a foundational level that has defined its market structure for years. The $14.28 mark isn't just another number on a chart—it's the battleground where long-term conviction meets short-term fear.
The Multi-Year Floor
That multi-year support line is doing the heavy lifting right now. It's the level where previous sell-offs ran out of steam and bullish reversions began. Every touch reinforces its psychological and technical significance, creating a self-fulfilling prophecy of defense. Market watchers aren't just looking at a price—they're watching a narrative of resilience play out in real-time.
Decoding the Slip
The slip to $14.28 signals more than routine volatility. It represents a controlled test, a deliberate probe by the market to see if the foundational trust in oracle networks and decentralized data holds under pressure. In a sector where sentiment shifts faster than a crypto trader chasing the next narrative, holding this line is a quiet statement of utility over hype.
The Road Ahead
What happens here sets the tone. A firm bounce off support reignites the thesis of Chainlink as critical infrastructure, its price action reflecting its embedded role in DeFi's plumbing. A failure, however, opens a conversation about re-pricing risk in even the most 'essential' protocols. It's a reminder that in crypto, even the most robust fundamentals take a backseat when liquidity gets nervous—proving once again that the market can ignore a good story longer than most projects can stay solvent.
Despite short-term pressure, the coin maintains its multi-year ascending support structure, a formation that many analysts view as a foundation for a longer-term bullish breakout.
With volatility compressing and structural resilience still intact, the coin enters a phase where accumulation and patience take center stage.
Multi-Year Triangle Shows Firm Support as Long-Term Buyers Defend the Base
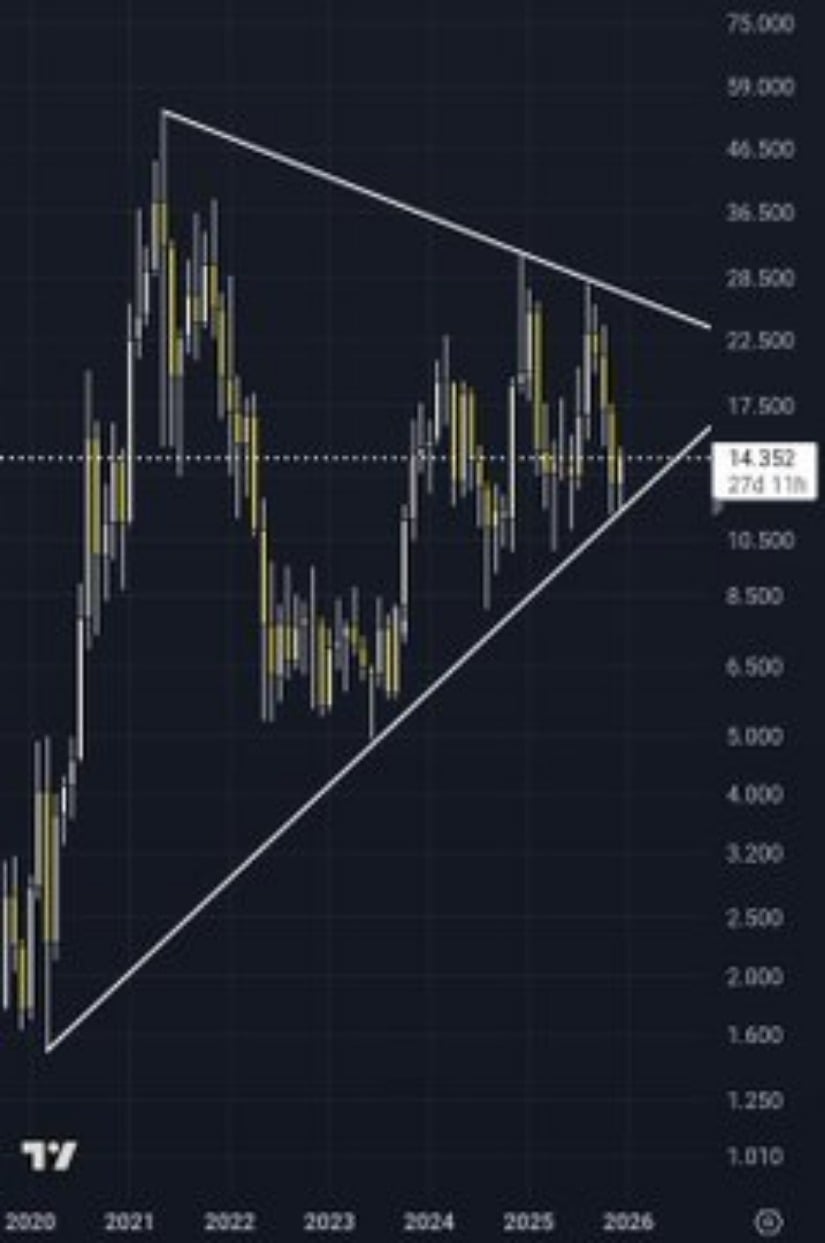
The long-term triangle pattern visible on the chart highlights a multi-year tightening structure that began forming in late 2020. LINK has repeatedly tested the ascending trendline that connects its macro lows, and each retest has been met with notable buying activity. The most recent interaction with this support zone again resulted in price stabilization around the $14 region.
Source: X
The descending upper boundary of the triangle captures a series of lower highs that have constrained bullish momentum for several years. The price is now approaching the apex of this formation, where tightening liquidity and reduced volatility typically result in a decisive breakout either upward or downward. Current price action shows the coin repeatedly pressing into mid-range levels between $14–$17, demonstrating persistent buyer interest.
Volume remains relatively subdued, consistent with a market that is building energy rather than distributing. This compression phase often precedes strong directional movement. As long as the coin holds above its macro support line, the structure favors long-term bullish continuation.
In a separate chart highlighting mid-term trends, the token has demonstrated repeated rebounds from the $14.0–$14.3 support band. Despite periodic pullbacks, the token continues forming higher lows within the larger pattern. With the multi-year trendline acting as a key defensive zone, long-term holders appear committed to maintaining structural integrity.
LINK Down 3.50% but Market Cap Holds $9.94B With Strong Liquidity
BraveNewCoin lists the coin at $14.28, supported by a market capitalization of $9.94 billion and daily trading volume of $687.78 million. This DEEP liquidity continues to place the token among the most heavily traded altcoins, providing reliable execution even during volatility.
Short-term data shows intra-day lows around $14.03 and highs NEAR $14.80, indicating the presence of both bargain buyers and defensive sellers at local levels. The token remains significantly below its all-time high of $52.70, down 72.90%, but its supply of 696.85 million tokens continues circulating across major markets with steady participation.
Even with the recent price decline, the asset retains a stable base of long-term investors, making the coin one of the more structurally consistent assets among large-cap altcoins.
Multi-Year Support Held “Looks Ready for ATH Heading Into 2026”
Crypto analyst @nicucrypto highlights that the token has once again held its multi-year rising support line, emphasizing that the macro structure remains intact. According to his analysis, the coin’s ability to maintain this trendline despite market uncertainty suggests the asset may be positioning itself for a long-term bullish cycle.
Source: X
He notes that the compression between the macro support line and the descending multi-year resistance creates a technical environment where probability favors a breakout to the upside. This aligns with historical behavior in large symmetrical triangles, where long-term structural resilience often precedes expansion phases.
If the asset breaks above the multi-year resistance — a zone currently sitting near $22–$26 — analysts argue that the path toward new all-time highs becomes increasingly realistic heading into 2026.
