HYPE at Critical Juncture: $30-$32 Support Zone Becomes Make-or-Break Level as Bears Tighten Grip

Hyperliquid faces its moment of truth as selling pressure intensifies across derivatives markets.
The Battle for $30
Traders are watching the $30-$32 support band like hawks—break this level and we could see cascading liquidations. The bears have been methodically building their positions, creating what technical analysts call a 'coiled spring' setup.
Market Mechanics at Play
Funding rates turned negative while open interest patterns suggest professional money is positioning for further downside. Retail traders keep buying the dip—because what could possibly go wrong buying an asset that's already down 60% from its highs?
The Institutional Perspective
Meanwhile, traditional finance veterans watch from the sidelines, muttering about 'fundamental value' and 'cash flows' while missing the entire point of crypto markets.
Either HYPE holds this critical support and stages a vicious squeeze higher, or we're looking at a quick trip to the $25 zone. Place your bets—the casino is open 24/7.

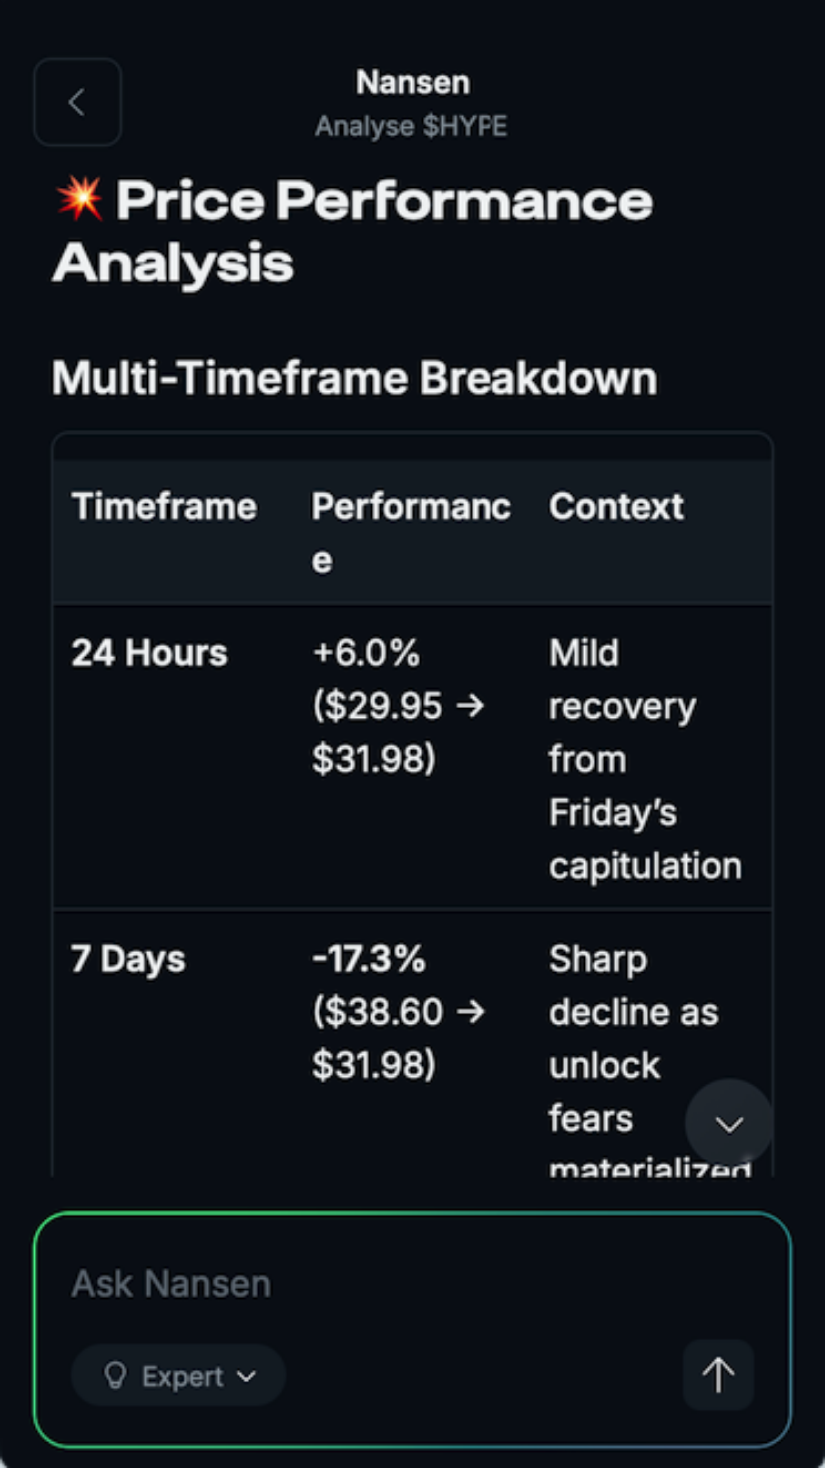
HYPE has slipped into a tense moment after breaking its neckline, and the market is reacting with a mix of concern and opportunity. Price has clearly weakened, yet on-chain participation, inflows, and volume are holding far stronger than expected. Hyperliquid has created one of those rare phases where technical pressure is pointing downward, but on-chain activity is pointing in a different direction.
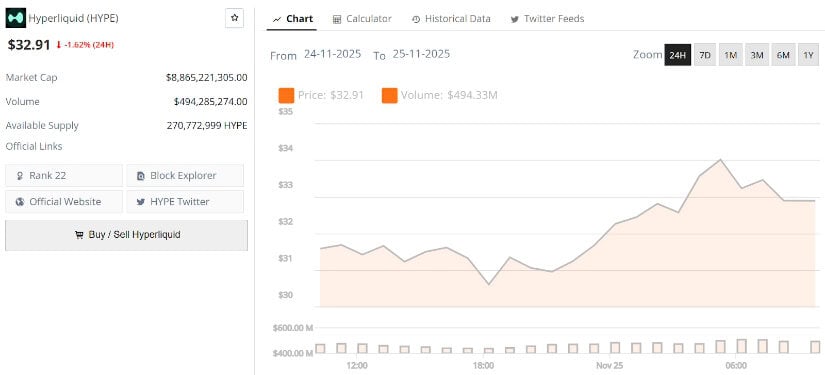
Hyperliquid’s current price is $32.90, down -1.62% in the last 24 hours. Source: Brave New Coin
HYPE Under Pressure After Neckline Break
HYPE chart shows the head-and-shoulders pattern has now officially broken down, with price slipping below the neckline around $37–$38. This breach signals that sellers are in control, and the reaction so far has been weak, with no strong attempt to reclaim lost ground. The structure suggests a potential continuation MOVE lower unless buyers step in quickly.
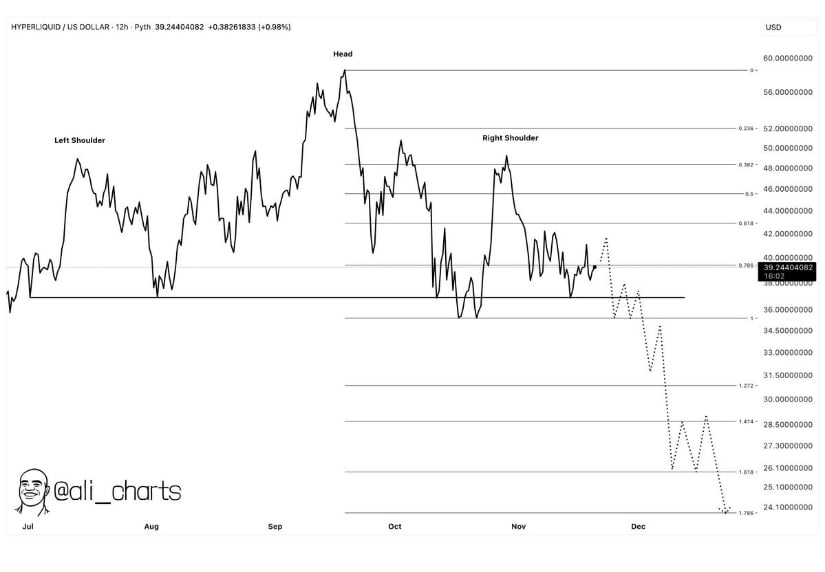
HYPE slips below its neckline as the head-and-shoulders breakdown accelerates downside momentum toward key support levels. Source: Ali Martinez via X
With the neckline gone, famous crypto analyst Ali Martinez believes that the measured move maps out potential downside areas at $33, $30, $28, and $26. The dotted projection on the Hyperliquid chart reflects how fast momentum can accelerate once a major support breaks. For now, the HYPE is following that trajectory closely.
On-Chain Holding Strength Despite Price Weakness
HYPE’s HIP-3 ecosystem is pushing $309M in daily volume, a standout figure during a period when price is losing structure. High transaction FLOW in a corrective phase often signals that the project still maintains strong participation and liquidity.
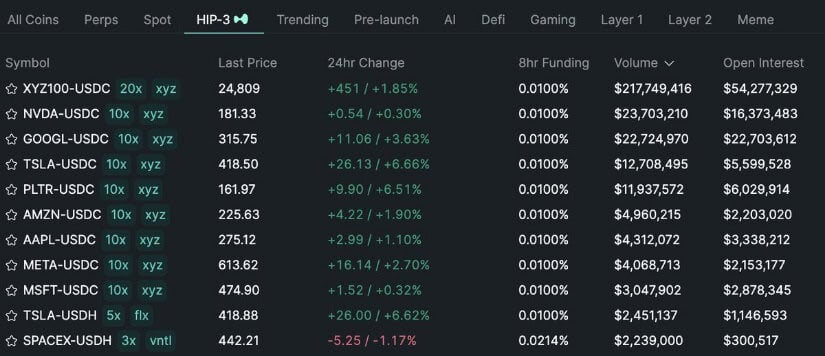
HYPE’s on-chain activity remains unusually strong. Source: McKenna via X
Funding remains flat, OI is steady, and the distribution across pairs shows consistent flow. These metrics suggest that while price is correcting, market engagement hasn’t faded. It gives HYPE a stronger base compared to most assets in similar technical conditions.
Trendline Breakout Could be a Sign of Strength
Lucky’s chart lays out Hyperliquid’s larger picture: despite volatility, HYPE is still trading inside its major range, with support NEAR $33–$34. Even after losing the neckline, the broader range hasn’t broken. The descending trendline from the highs continues to cap upside attempts, but the compression is tightening and usually leads to a decisive breakout.
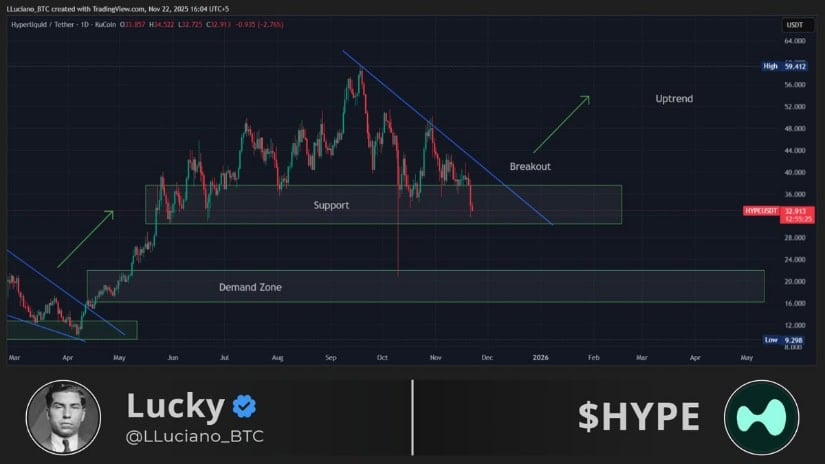
HYPE continues to compress within its broader range, with the descending trendline acting as the next major trigger level to watch. Source: Lucky via X
If HYPE reclaims the trendline, upside levels re-open towards $42, $48, and prior highs near $55. Until then, this remains a range-play environment. The demand zone at $30–$32 is the final line that must hold to keep this narrative alive.
Contrary Signals Emerging Despite Fears
The recent data shared by Nansen shows a surprisingly bullish side to the current narrative. While many fear the unlock, larger players aren’t showing the same concern. Pantera Capital reportedly added +51.7K, fresh wallets poured in $3.9M, and buybacks continue absorbing around $5M per day. These are not the behaviors you see during a distribution phase.
Fresh inflows, wallet growth, and daily buybacks show quiet accumulation despite bearish price action. Source: Nansen via X
If this were a distribution, inflows wouldn’t be rising, instead, it looks like supply is being absorbed quietly. This sets up a strong contradiction: while price action leans bearish, on-chain Flow points towards accumulation. If momentum picks up, this could quickly shift sentiment.
Fractal Hinting at a Potential Bottom
HYPE is retesting a major support block that acted as a springboard earlier in the year. The current chart shared by Kasper is closely mirroring that previous fractal: a drop into support, a rounded bottom, and a sharp recovery. The highlighted zones align almost perfectly with past behavior, suggesting this could be another accumulation phase.
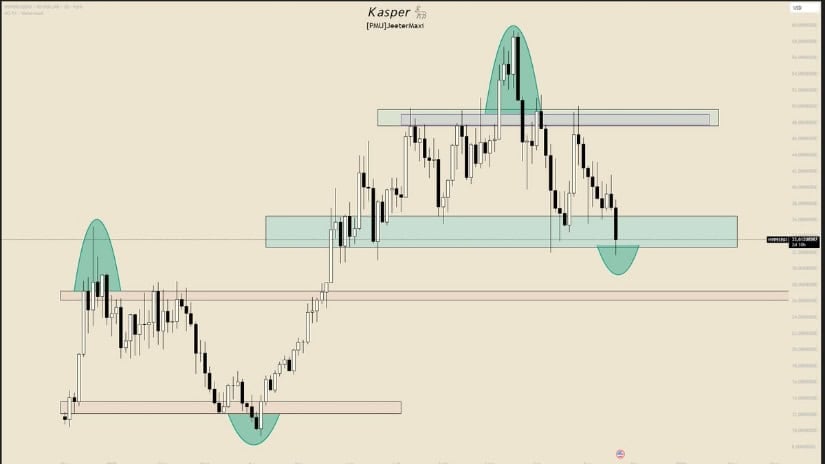
HYPE’s current pullback mirrors an earlier-year fractal, hinting at another potential springboard from support. Source: Kasper via X
If the fractal continues to play out, the next step WOULD be a reclaim of the mid-range at $40, followed by expansion into the upper supply at $48–$50. The setup isn’t confirmed yet, but the similarities are strong enough to keep an eye on.
Final Thoughts
HYPE is in a mixed but very important spot. The neckline breakdown adds real downside risk, and sellers are still dictating short-term movement. But strong on-chain volume, steady inflows, stable funding, and accumulation signals keep the medium-term outlook more balanced than the chart alone suggests.
As long as the $30–$32 zone holds, HYPE can still FORM a recovery base. A reclaim of the descending trendline would be the first major shift in momentum.
