WLD at Critical Juncture: Will Demand Zone Spark Next Rally?

Worldcoin (WLD) teeters on the edge—again. The token's clinging to a key demand zone like a trader to their last hope of green candles. Here's what comes next.
### The Make-or-Break Moment
Every chart watcher knows these levels matter. WLD's current perch could either launch it toward recovery or send it tumbling into 'I told you so' territory. No middle ground.
### Why This Time Might Be Different
Market cycles don't repeat—but they sure rhyme. The current accumulation pattern mirrors previous bottoms before 2-3x runs. Of course, past performance guarantees nothing except hedge fund marketing materials.
### The Cynic's Corner
Let's be real—half the 'demand zones' in crypto are just places where bagholders pray while VCs unlock more tokens. But when the momentum shifts, even skeptics chase the pump.
Watch the volume. Watch the macro climate. And maybe—just maybe—keep one finger near the buy button.

As analysts monitor whether accumulation is building or a breakdown is imminent ahead of the next directional move.
Analyst Points to Key Demand Zone & Fibonacci Targets
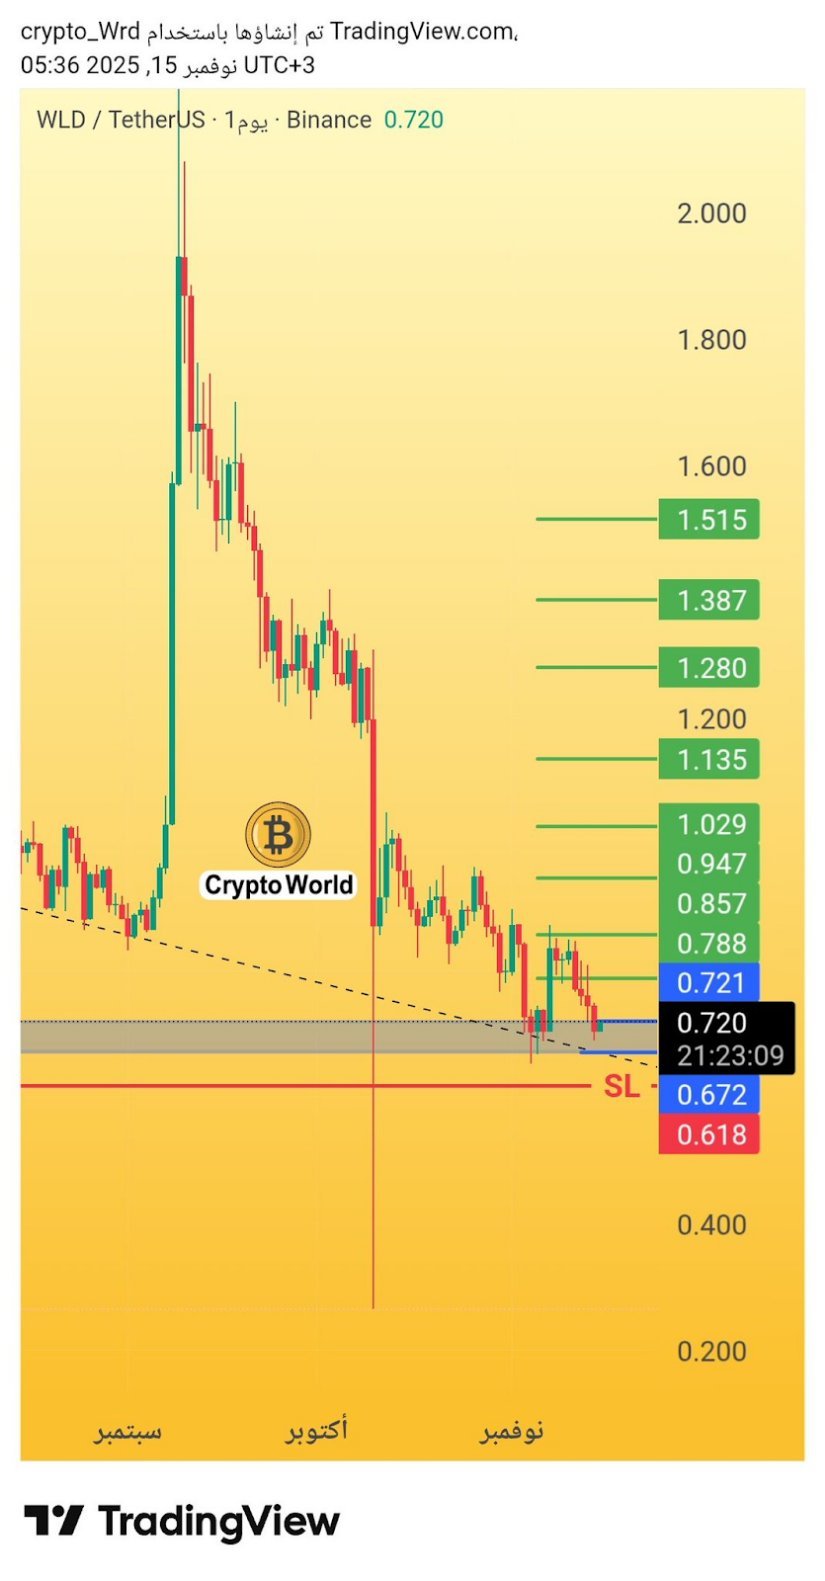
Analyst crypto World indicates that the coin is trading inside a defined demand zone with clear entry levels, upside projections, and a stop-loss criterion if a daily candle closes below the 0.618 level. On the chart, the price sits around 0.720, positioned just above a long-time descending trendline support.
Source: X
The chart also includes Fibonacci levels with progressive upside targets at 0.788, 0.857, 0.947, 1.029, and ultimately 1.515. Each of these levels serves as a possible resistance zone where partial profit-taking may occur if the structure unfolds.
However, the bullish outlook hinges on holding the support band around 0.672–0.618; a daily close below this WOULD invalidate the setup and expose further downside risk.
Price Action and Open Interest Signal Market Stalemate
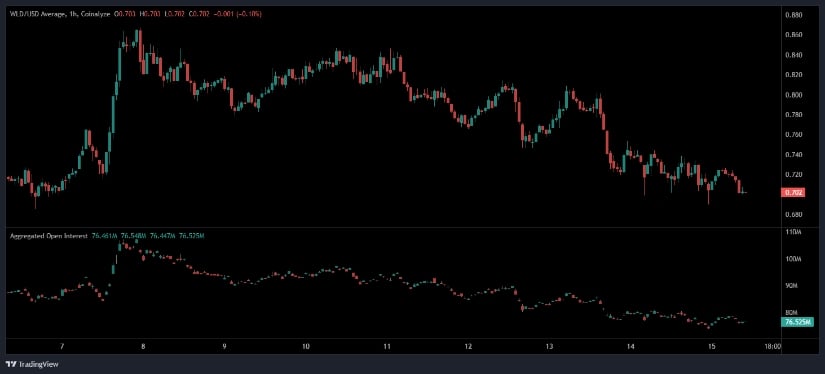
The recent chart action reveals a clear downtrend structure: the coin peaked NEAR ~0.86, then formed a sequence of lower highs and lower lows, showing persistent selling pressure. Bullish rallies have lacked strength, which implies that buyers are not yet in control. Currently, the price hovers around the 0.70 area, consolidating but still within a bearish-leaning regime.
Source: Open Interest
The Aggregated Open Interest (OI) metric paints a similar picture: as price dropped, OI fell — showing that traders were unwinding rather than opening new positions. This indicates generally low conviction among Leveraged participants. OI has since stabilized around 76.5 M, which may hint at building positioning ahead of a potential volatility event. Should WLD break below 0.70, continuation downward is probable; conversely, reclaiming 0.74–0.75 could mark early signs of a reversal.
Worldcoin Data Reflects Gradual Accumulation Trend
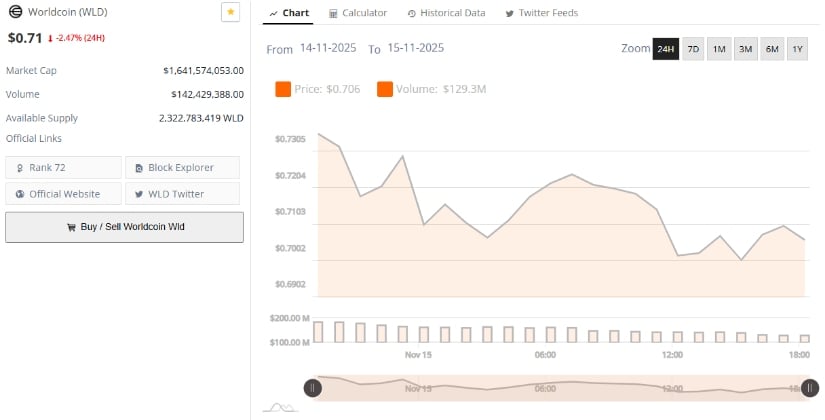
As of November 15, 2025, data from BraveNewCoin shows that Worldcoin trades at $0.79, reflecting a 0.50% daily increase. The token holds a market capitalization of $1.64 billion and reports $142.42 million in 24-hour trading volume, with 2.32 billion tokens in circulating supply, ranking it #72 by global market capitalization.
Source: BraveNewCoin NOVEMBER 2025
While price action has remained relatively steady in recent sessions, gradual outflows from exchanges into self-custody wallets suggest strengthening confidence among long-term holders. Analysts interpret this as an early signal of reduced circulating supply, potentially setting up conditions for future upward volatility.
Technical Indicators Show Compression Ahead of Breakout or Breakdown
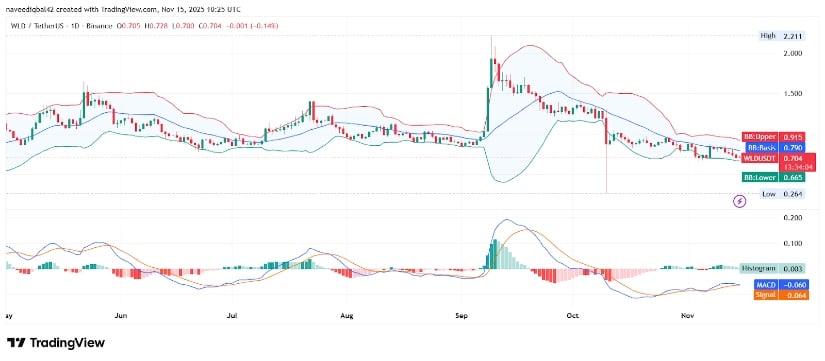
At press time, WLD/USDT trades near $0.704, reflecting ongoing weakness on the daily timeframe. The chart shows price riding along the lower region of its Bollinger Bands, indicating oversold territory with low volatility.
The baseline (middle band) at approximately $0.79 is acting as dynamic resistance, while the upper band near $0.915 remains well above current levels, highlighting how compressed the market is.
Source: TradingView
Momentum indicators remain bearish: the MACD line (–0.060) sits below the signal line (–0.064), though the histogram is nearing a neutral point, suggesting selling momentum may be waning.
Candlesticks show long wicks and tightening ranges, signs of indecision, but without a surge in volume, rebounds are likely to be weak.
