OP Price Alert: Wedge Support Holds Firm as Traders Eye Bullish Breakout

Crypto traders are glued to Optimism (OP) as it clings to a critical support level—will the wedge pattern trigger the next rally or another fakeout?
The Setup: OP's price action coils tighter than a spring, testing patience and stop-losses alike. A decisive close above resistance could send it soaring; failure means retesting the lows.
Why It Matters: With the broader market in 'wait-and-see' mode, altcoins like OP live or die by technicals. No mercy for the unprepared.
The Punchline: Traders betting on a breakout might get their wish—or learn yet another expensive lesson about crypto's favorite pastime: liquidating overleveraged dreamers.

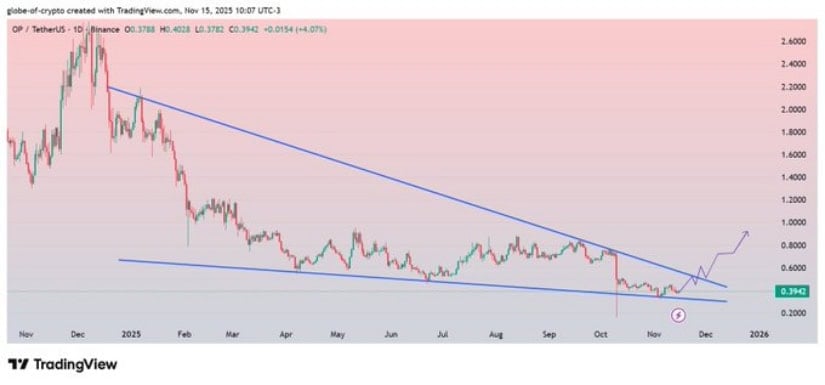
Recent market commentary highlights a developing falling wedge structure, traditionally viewed as a potential bullish continuation pattern if confirmed through a decisive breakout accompanied by sustained volume.
Analyst Flags Falling Wedge Structure on Daily Chart
In a recent post shared on X, market analyst Globe Of crypto stated that OP is currently consolidating near the edge of a falling wedge pattern on the daily timeframe, a zone that has historically attracted speculative interest during extended corrective cycles.
According to the analyst, a rebound scenario remains technically valid if the coin maintains structure above its immediate compression area, with a possible 100–120% upside projection outlined as a mid-term scenario rather than a short-term trigger.
Source: X
The shared chart illustrates the wedge resistance line gradually descending from the previous cycle high while price action continues to compress toward the apex. This type of structure typically requires confirmation through breakout candle closure supported by volume expansion, eliminating the risk of a false breakout. The analyst’s view remains conditional and does not imply directional certainty, instead presenting a structured scenario based on chart geometry and historical pattern behavior.
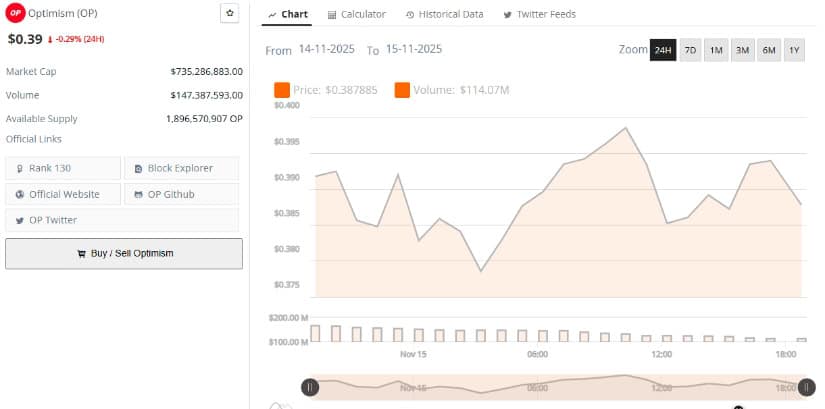
Negative Daily Change While Liquidity Remains Healthy
As of the latest BraveNewCoin update, OP is priced at $0.39, reflecting a -0.29% daily change, while its market capitalization stands at $735,286,883.00, and 24-hour trading volume sits at $147,387,593.00. The circulating supply is recorded at 1,896,570,907 OP, positioning Optimism at Rank 130 within the broader cryptocurrency market segment.
Source: BraveNewCoin
The price distribution chart shows intraday movement between $0.375 and $0.405, indicating continued tight volatility. Although price performance remains under neutral pressure, liquidity metrics, specifically volume turnover relative to market cap, suggest that the coin retains active market participation.
This supports the notion that price compression is technical rather than caused by market abandonment. However, no directional bias can be established based solely on liquidity unless paired with structure-based confirmation.
TradingView Indicators Reflect Mixed Momentum With Key Levels Intact
Based on the TradingView chart, OP trades NEAR $0.3920 and continues to oscillate within the Bollinger Bands lower half, with the Basis line around $0.4044 and the BB Upper at $0.4638, indicating that volatility remains compressed following recent downside extension. The lower band at $0.3450 aligns with a potential support retest zone if price fails to sustain above current levels.
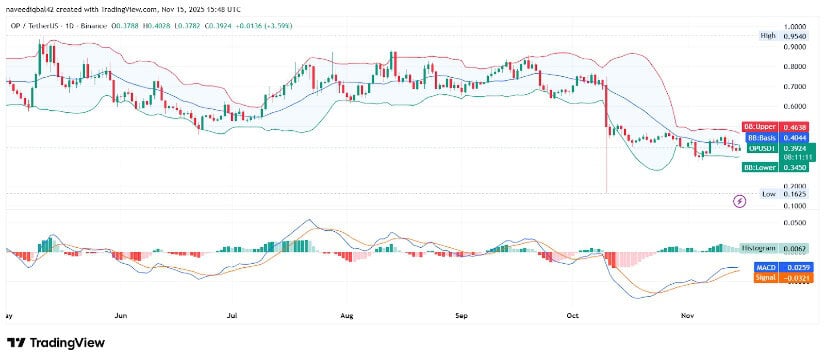
Source: TradingView
MACD positioning shows both signal and MACD lines below the zero axis, reflecting subdued bullish momentum despite a minor slope shift toward neutrality. This aligns with a scenario of stabilization rather than confirmed reversal.
The falling wedge trendline drawn on the higher-timeframe chart further reinforces that OP remains at a structural inflection point rather than inside a completed breakout sequence.
