Uniswap’s UNI Token Pulls Back After Testing Weekly Highs – What’s Next for the DeFi Giant?

UNI bulls retreat as DeFi's favorite governance token hits resistance. The Uniswap token briefly flirted with weekly highs before bears stepped in—classic crypto volatility at play.
Key Levels to Watch
Traders are eyeing critical support zones after this rejection. The pullback could either setup a higher low or confirm weakening momentum if key levels crack.
Market Sentiment Shifts
DeFi blue chips like UNI are weathering the storm better than most altcoins—though 'weathering the storm' in crypto often means losing slightly less value than competitors. A true badge of honor in this space.
What Traders Are Saying
Options flows show some big bets on a Q4 rally, but perpetual funding rates suggest leveraged traders got caught overexposed during the recent pop. Same old story—greed giveth, and greed taketh away.

Uniswap coin sees a sharp reversal after sweeping last week’s range high, with analysts watching key support NEAR $7–$8 and questioning whether the move signals exhaustion or sets up the next breakout attempt.
Weekly Range Sweep Triggers Reversal
According to the post, the MOVE triggered a sharp drop of over 25%, indicating the sweep functioned as a distribution event, not a continuation.
The shaded zone on the chart traces the move from the Monday high, through the mid-range, and toward the lower boundary, confirming the reversal behavior.

Source: X / WoodsBot
The analyst points out that when early-week ranges are violated and then reversed, they often signal deeper retracements rather than breakout setups. Forthe, this means that while initial momentum appeared strong, the reversal suggests caution until support zones hold and new trend structure forms.
Technical Setup Suggests Consolidation or Breakout Decision
Another post on x from another analyst depicts the UNI/USDT pair, showing a descending trendline that has capped prices after prior lower highs and lower lows. The chart indicates an earlier sharp run into the $12.30 high, followed by profit-taking and recent consolidation between roughly $7 and $8.
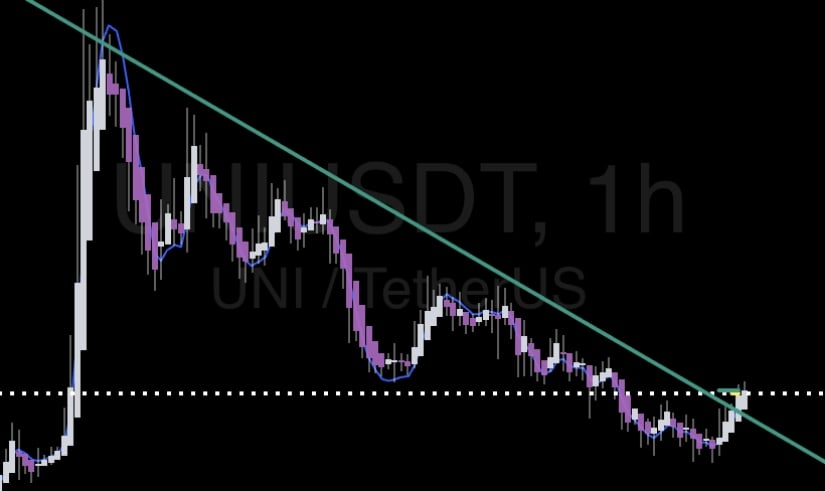
Source: X
Commentary from X suggests that the coin must reclaim the descending resistance to reset momentum. Failure to do so may keep the price locked in the consolidation band. Conversely, a breakout above trendline resistance could shift the structure toward an upward move. The key is volume confirmation and breaking above the resistance zones.
UNI Consolidates Near $7.17 as Market Stabilizes
As of November 15, 2025, data from BraveNewCoin shows the coin trading at $7.17, reflecting a 6.83% daily decline amid wider market consolidation. Despite the short-term retracement, structural support remains firm between $6.30 and $6.50, aligning with mid-range Fibonacci zones that have historically served as accumulation areas.
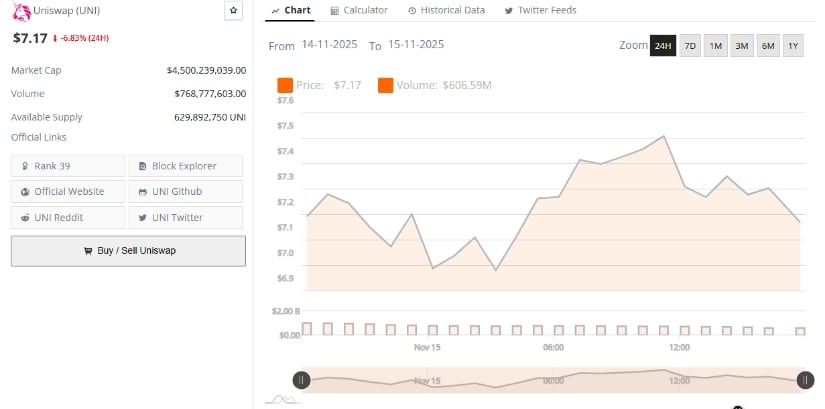
Source: BraveNewCoin, November 2025)
The coin’s market capitalization stands at $4.50 billion, with daily trading volume of $1.11 billion and 629.89 million Tokens in circulation, ranking it #39 globally by market cap. While short-term volatility persists, analysts point to continued on-chain stability and steady liquidity inflows as signs that buyers are maintaining control of the mid-range structure.
Whether consolidation within the $7–$8 region forms a launch base or extends into a deeper pullback will depend on market participation as liquidity conditions evolve.
Indicators Show Early Recovery but Resistance Remains Strong
At press time, UNI trades near USDT 7.329, reflecting a +4.82% daily gain. On the Bollinger Bands, price sits above the basis line (~USDT 6.452), with the upper band near USDT 8.637 and the lower band near USDT 4.266, highlighting elevated volatility. The most recent high at USDT 12.30 remains major overhead resistance.
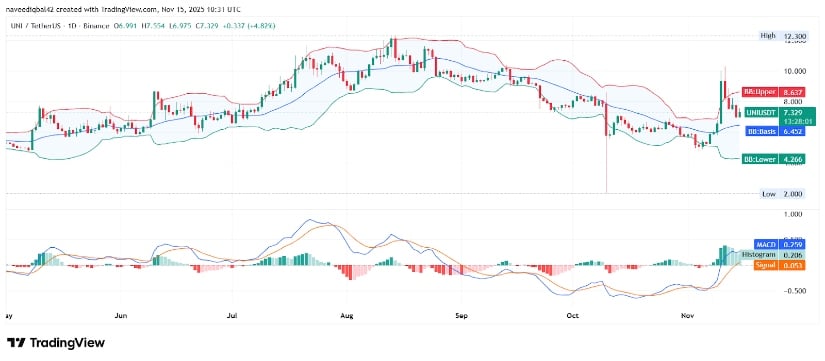
Source: TradingView
The MACD shows the MACD line at 0.259, above the signal line at 0.053, with a green histogram indicating early bullish momentum. However, prior peaks near upper bands have led to sharp retracements, so a valid upside ideally requires a breakout above the resistance zones. Until then, the price may consolidate or pull back before any strong directional move.
