Uniswap’s Bull Flag Breakout: $14 Target in Sight as DeFi Momentum Builds

DeFi's favorite DEX just flashed a textbook bullish signal—strap in for the ride.
The Technical Setup
That bull flag pattern everyone's been eyeing? Shattered. Uniswap's chart now screams upside potential, with traders targeting a $14 surge. Not bad for a protocol that was 'supposed to be obsolete' when Coinbase launched its own DEX.
Why This Matters
Liquidity pools are swelling, fee switches are flipping, and suddenly that 'outdated' UNI token looks like the sharpest tool in the DeFi shed. Meanwhile, centralized exchanges are busy explaining why their 'low fees' require 47 layers of KYC.
The Bottom Line
Market structure says buy. The only question is whether you'll FOMO in at $12 or wait for the pullback that never comes. Just remember—in crypto, the 'smart money' is usually the money that moves first.

Market data shows growing accumulation and narrowing volatility, supporting analyst expectations that he coin price could reclaim the $11 zone and potentially advance toward $14 in the coming rally cycle.
Bull Flag Setup and Fibonacci Resistance Levels
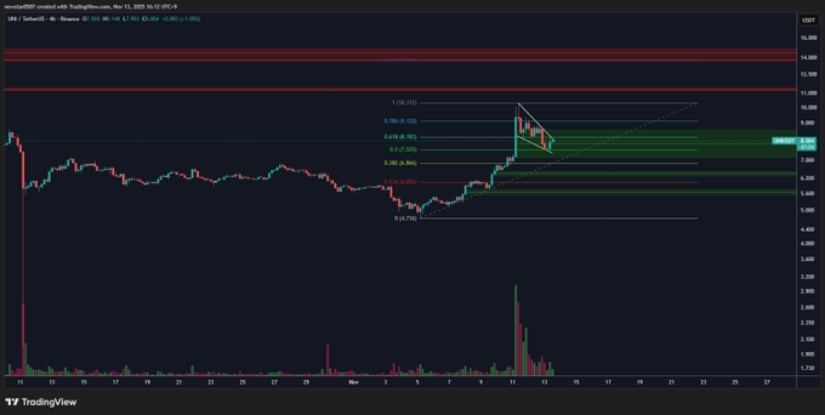
Crypto market analyst CW, who regularly shares technical setups on X, noted in a November 2025 post that Uniswap is nearing the final phase of consolidation within a descending wedge formation. According to CW, this structure commonly signals exhaustion of corrective pressure before trend continuation.
(Source: X/@CW8900, November 2025)
CW identified $11 as the key “sell-wall” resistance, coinciding with the 1.0 Fibonacci retracement level, while the 1.618 extension projects a possible upside target NEAR $14. The analyst’s chart highlights converging trendlines compressing volatility, an early technical cue that seller dominance may be weakening.
A confirmed breakout above the upper wedge line, paired with an increase in trading volume, WOULD reinforce continuation of the broader Q4 bullish trend observed since late October.
UNI Consolidates Near $7.85 as Market Stabilizes
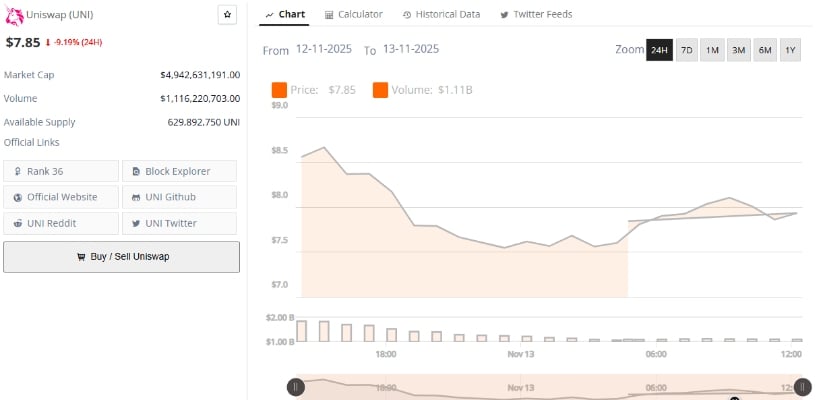
As of November 13, 2025, data from BraveNewCoin shows the coin trading at $7.85, reflecting a 9.19% daily decline amid wider market consolidation. Despite the short-term retracement, structural support remains firm between $6.30 and $6.50, aligning with mid-range Fibonacci zones that have historically served as accumulation areas.
Source: BraveNewCoin, November 2025)
The coin’s market capitalization stands at $4.94 billion, with daily trading volume of $1.11 billion and 629.89 million Tokens in circulation, ranking it #36 globally by market cap. While short-term volatility persists, analysts point to continued on-chain stability and steady liquidity inflows as signs that buyers are maintaining control of the mid-range structure.
Whether consolidation within the $7–$8 region forms a launch base or extends into a deeper pullback will depend on market participation as liquidity conditions evolve.
Technical Indicators Signal Volatility Expansion and Momentum Recovery
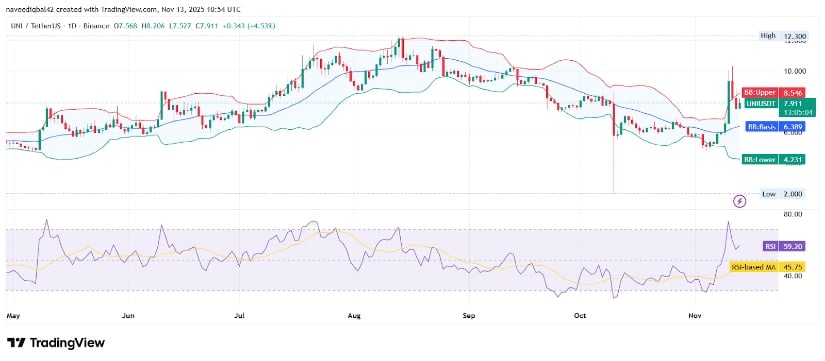
According to recent data, the UNI/USDT pair on TradingView shows Bollinger Bands widening, indicating renewed volatility after a period of compression. Price currently trades near the upper band at $8.53, suggesting growing trader engagement, while the baseline at $6.38 functions as a dynamic support threshold. A failure to maintain this level could open the path toward the lower band at $4.23, marking the next structural support zone.
(Source: TradingView, UNI/USDT — November 2025)
Meanwhile, the Relative Strength Index (RSI) has risen to 58.89, rebounding from the mid-40 range — a technical sign of strengthening momentum without entering overbought conditions. Historical RSI reversals within this zone often precede sustained rallies, providing further technical validation for CW’s bullish thesis. However, analysts caution that confirmation requires both a clean breakout above $11 and consistent volume expansion.
