Stellar (XLM) Price Poised for Breakout as Higher Low Pattern Signals Bullish Momentum

Stellar's XLM flashes bullish signals—traders eye next leg up.
Higher low formation suggests accumulation—smart money moving in?
Meanwhile, traditional finance still can't decide if crypto is a 'tulip mania' or the future. Spoiler: it's both.

Analysts note that while most altcoins remain under pressure, the coin’s technical structure hints at relative strength, a higher low pattern that could set the stage for recovery if momentum improves.
XLM Prints Higher Low Despite Broader Market Weakness
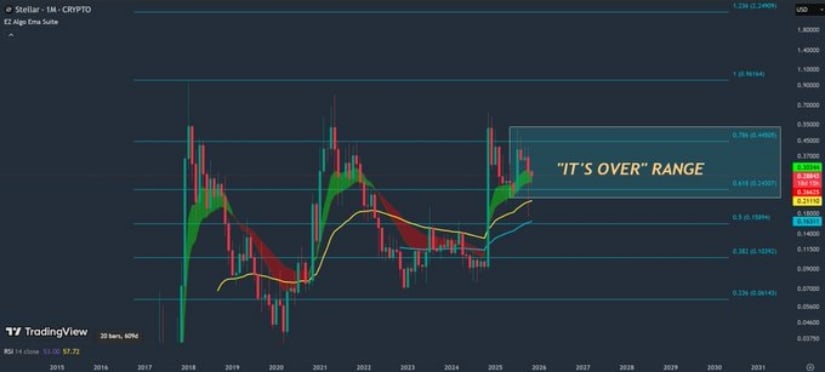
In a recent X post analyzed by BeInCrypto, the chart shows that Stellar, like many other digital assets, lost momentum after peaking in mid-summer. The analyst highlighted that exponential moving averages (EMAs) have flattened or turned bearish, indicating a cooling market phase. However, the con stands out by forming a higher low (HL) while the broader USDT.D chart registers a lower high (LH).
Source: X
This pattern implies that while overall liquidity in the market remains tight, the coin is holding firm within what the analyst calls the “it’s over” range — a zone where most altcoins continue to decline. The formation of a higher low reflects relative strength and hints that accumulation might be occurring at current levels, laying the groundwork for a potential bullish reversal if broader sentiment improves.
Market Data Shows Consolidation Near 0.28 USDT
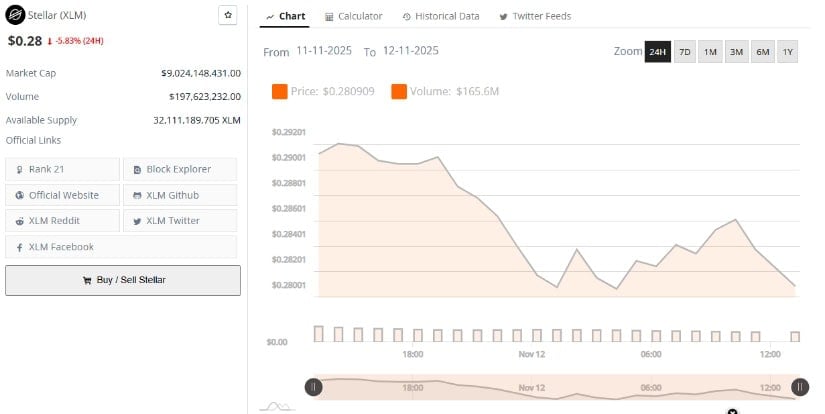
According to BraveNewCoin, stellar currently trades at 0.28 USDT, marking a 5.83% decline over the last 24 hours. The token’s market capitalization stands at approximately 9.02 billion USDT, with a 24-hour trading volume of 197.62 million USDT and a circulating supply of 32.11 billion tokens.
Source: BraveNewCoin
Despite the recent price drop, these metrics reflect continued activity and stability within the coin’s ecosystem. Analysts point to its consistent trading volume as evidence of ongoing participation from long-term holders, even amid market-wide caution. The price has ranged between 0.276 USDT and 0.290 USDT over the past day, suggesting the asset is consolidating within a tight channel as buyers look for confirmation of trend continuation.
Technical Indicators Signal Neutral Momentum But Growing Resilience
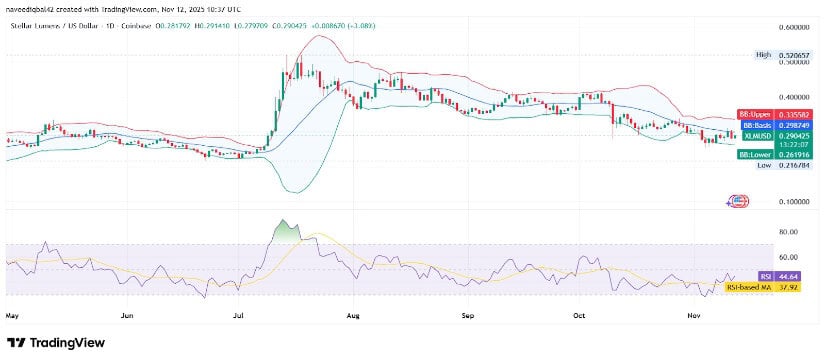
On the other hand, the TradingView daily chart of the coin shows that the token is consolidating below the Bollinger Bands’ middle line, reflecting ongoing resistance. The Bollinger Bands have narrowed since the July volatility expansion, indicating reduced market participation and a pause in strong directional movement.
Source:X
The RSI currently reads 43.86, with its RSI-based moving average at 37.86, suggesting weak but stabilizing momentum. During the mid-summer rally, RSI levels had climbed above 70, marking overbought territory before the subsequent correction. Since then, the indicator’s return toward neutral levels shows reduced selling pressure and a gradual balance between buyers and sellers.
