Chainlink (LINK) Primed for Explosive Rally: Analysts Target $50 as Breakout Gains Momentum

Chainlink’s native token LINK is flashing bullish signals—and analysts aren’t holding back. A surge toward $50 looks increasingly likely as key technical and on-chain metrics align.
Why the optimism? The oracle network’s critical role in DeFi and real-world asset tokenization keeps demand steady—even when crypto markets wobble. LINK’s recent consolidation phase now appears to be a springboard, not a stall.
Of course, in a market where ‘number go up’ is the only fundamental some traders recognize, Chainlink’s actual utility might be irrelevant. But hey, at least this rally would be backed by something shinier than pure hype—even if Wall Street still doesn’t get it.

Technical indicators and whale accumulation signal a strong setup for a major bullish reversal.
Long-Term Structure Signals a Major Breakout
Analyst James Easton shared a long-term chart of Chainlink, showing a large symmetrical triangle formation that has been forming since 2020. The pattern reflects a tightening price range between an ascending support line and a descending resistance trendline.
The asset is currently trading NEAR $15.44, positioned around the midpoint of this setup after rebounding from the key horizontal support zone between $12 and $13.
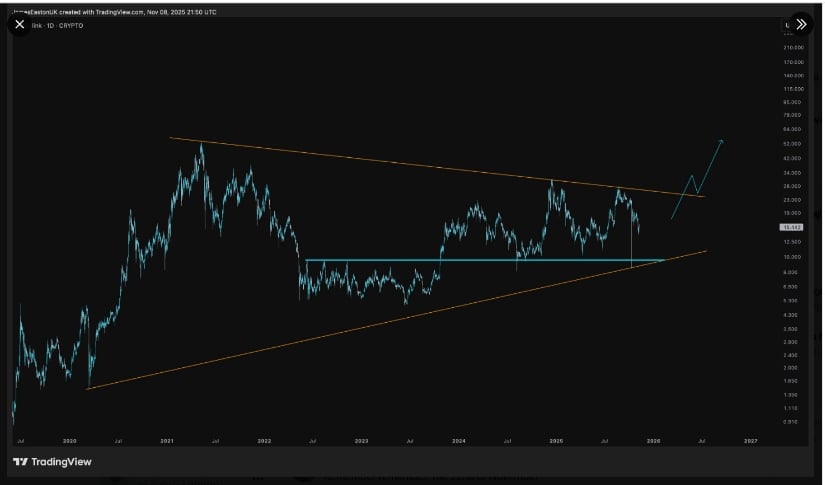
LINKUSD Chart | Source:x
Easton’s technical outlook indicates that the token is approaching the end of its multi-year consolidation phase. His projection outlines a potential upward breakout, initially toward $30–$35, and potentially beyond $50, if the price manages to close above the long-term resistance trendline. The chart also suggests that a minor pullback could occur before the breakout, forming a retest of the upper channel boundary before a continuation to higher levels.
Key Support Levels and Fibonacci Reversal Zone
Analyst Ali shared a detailed technical chart showing that chainlink has reached a crucial ascending support trendline, which has historically acted as a foundation for previous rallies. His analysis places its current trading zone around $14.70, aligning with the 0.618 Fibonacci retracement level, a region often associated with strong reversals in price cycles.
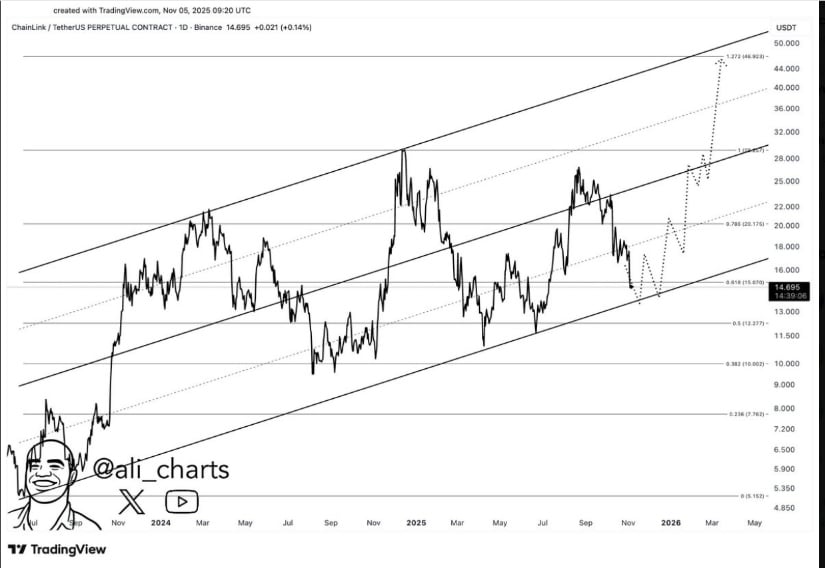
LINKUSD Chart | Source:x
Ali’s forecast includes two major upside targets once a confirmed rebound begins — an initial rise toward $26, followed by a potential extension toward $47. The path outlined on his chart anticipates gradual price recovery through $16 and $20, leading to a retest of the $28 resistance zone. A successful breakout above that level could open the path to the next major rally phase near $47, completing the upper trendline projection shown in his model.
Current Price Behavior and Market Outlook
At press time, Chainlink trades near $15.13, following a 3.91% daily decline. The short-term chart shows the price opening around $15.70 before facing consistent selling pressure that pushed it to the $15.00 region. Despite the decline, trading volume remains strong at $649.7 million, showing active participation among traders and investors.
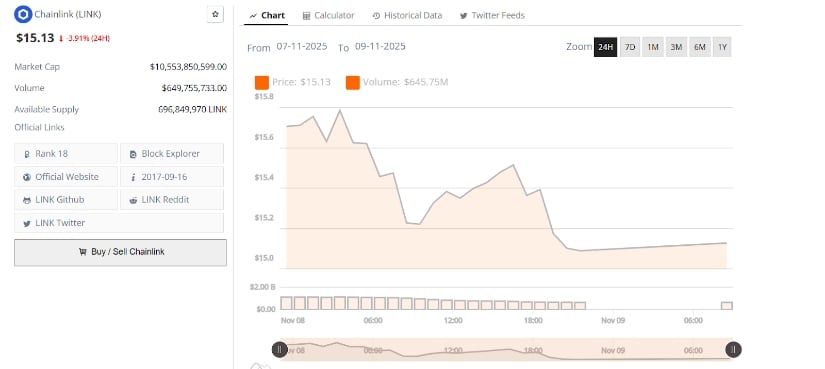
LINKUSD 24-Hr Chart | Source: BraveNewCoin
The intraday chart depicts a descending trendline, indicating reduced momentum after the latest accumulation phase. The token’s failure to hold above $15.50–$15.60 shows that short-term traders are taking profits at local highs. A decisive MOVE below $15.00 could open the door to the next support near $14.70, while stability above this level could signal the start of a new consolidation range before recovery attempts resume.
Broader Technical Context and Future Scenarios
From a wider perspective, the altcoin maintains a market capitalization of $10.55 billion, placing it within the top twenty digital assets by value. On-chain data indicates that recent whale accumulation remains intact, supporting the view that current selling pressure may be corrective rather than a structural reversal.
If buying interest returns at the established support levels, the asset could regain the $15.50–$16.00 range and potentially test $17 in the short term. The combination of long-term chart structures shared by Easton and Ali points toward a potential continuation of its broader uptrend. Both analysts emphasize that sustained defense of the lower trendline could set the stage for a rally toward the $50 zone, marking a new phase of growth in its multi-year market cycle.
