Solana Price Prediction: TD Sequential Buy Signal Hints at Explosive Rally from $150 Support

Solana flashes a rare bullish signal—traders are betting big on a reversal.
TD Sequential buy signal triggers at critical $150 support level.
Market sentiment flips as SOL shows resilience amid broader crypto volatility.
Will this be the launchpad for Solana's next leg up—or just another fakeout for bagholders? (Wall Street analysts remain 'cautiously optimistic,' which means they have no idea.)

After a week of intense sell pressure, Solana is showing early signs of stabilization as fresh technical and on-chain signals begin to align. The emergence of a TD Sequential buy signal, paired with strong liquidity support around $150, has sparked cautious Optimism among participants.
TD Sequential Flashes Buy Signal on Solana
A potential bottom could be forming on Solana’s latest dip, as Ali Martinez highlights a fresh TD Sequential buy signal on the daily chart. The indicator, known for catching early reversal points, aligns closely with Solana’s support cluster at $150 to $152, suggesting exhaustion in the recent downtrend. The pattern shows multiple consecutive red candles followed by a green “1” count, hinting at a relief phase on the horizon.
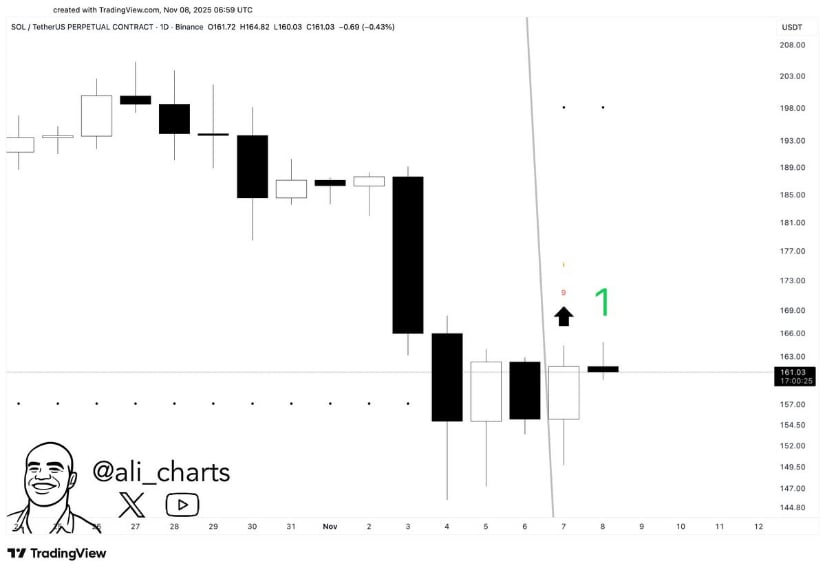
Solana’s daily chart flashes a TD Sequential buy signal, hinting at a potential rebound from the $150 support zone. Source: Ali Martinez via X
If Solana price maintains its footing above this $150 level, it could set the stage for a rebound towards the $165 to $170 zone, which previously acted as a liquidity pocket. The $150 floor remains pivotal, a sustained defense here would strengthen the probability of a bullish reversal.
Liquidation Levels Hint at Key Bottom Formation
Ted’s liquidity heatmap shows a dense accumulation of liquidation clusters around $145 to $150, indicating a potential liquidity sweep before a reversal unfolds. This area aligns with the same structural support identified across multiple solana timeframes, where demand has repeatedly returned following washouts.
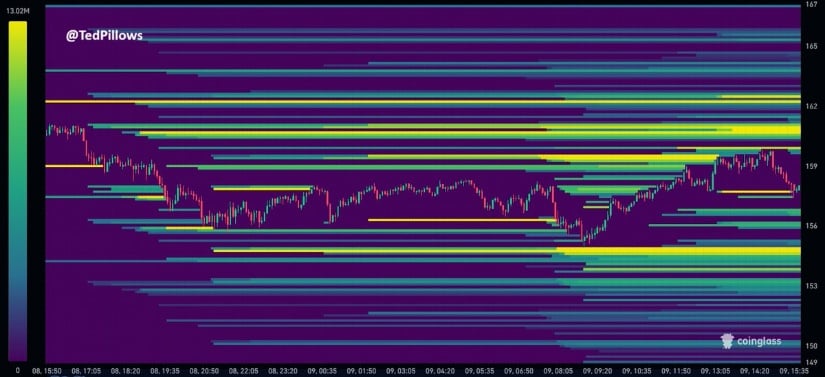
Solana’s liquidity heatmap reveals heavy liquidation clusters NEAR $145–$150, signaling a potential bottom zone forming ahead of a rebound. Source: Ted via X
While the current bounce appears weak, the clustering effect often precedes a market reversal as liquidity is absorbed. Once these lower levels are cleared, price tends to reprice upward rapidly towards unfilled orders in the $165 to $175 region. For now, maintaining stability above $145 remains critical, a close below could extend downside risk, but a rebound from this pocket would confirm that solana price has likely established a base.
Short-Term Upside Targets Align for Solana Price
The technical framework shared by James shows Solana price trading within a descending parallel channel, pressing against its lower boundary near $150. Historically, such retests near channel support have preceded sharp recovery phases, and a similar setup may now be unfolding. Should Solana price break back above the channel midpoint, the $180 mark becomes an achievable short-term objective, aligning with the upper boundary of the structure.
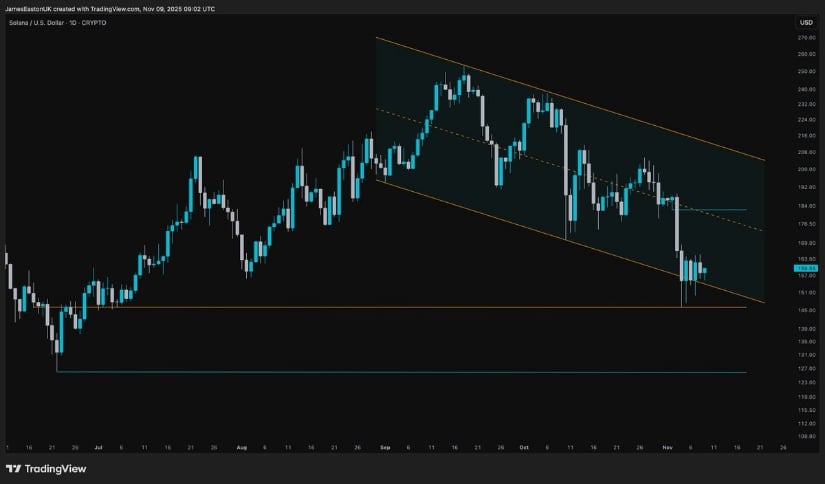
Solana’s chart shows price testing the lower boundary of a descending channel, hinting at a possible short-term rebound toward the $180 mark. Source: James via X
Momentum indicators show promising signals, the MACD histogram is narrowing while RSI builds positive divergence across lower timeframes. If this developing structure confirms with a clean break above $165, the first leg of a short-term relief rally could be underway, targeting resistance layers between $185 and $190 before the next consolidation.
On-Chain Activity Reinforces Solana’s Bullish Narrative
On the network side, Nansen reports that Solana continues to dominate blockchain activity with 17.2 million active addresses over the past week. The surge in daily transactions and user engagement underscores Solana’s strengthening ecosystem fundamentals, supporting the idea that recent price weakness is more technical than structural.
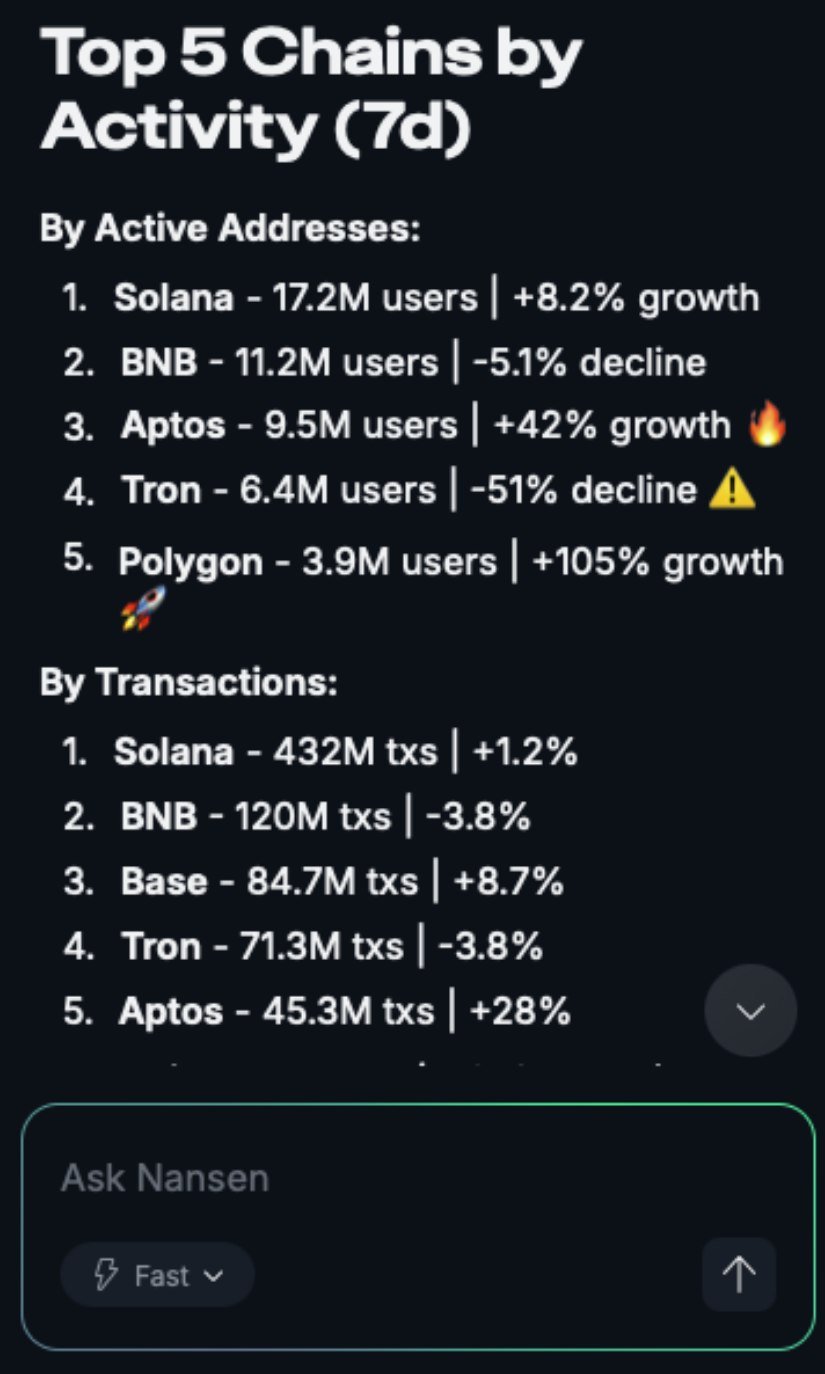
Solana maintains its dominance with 17.2 million active addresses and 432 million transactions in a week. Source: Nansen via X
With over 432 million transactions processed in the same period, Solana remains the most active L1 chain outside Ethereum. The consistent rise in user throughput and stable developer activity provides a fundamental safety net, making any dips into the $145–$150 region increasingly attractive.
Final Thoughts: Solana Bulls Defend a Critical Level
Solana’s chart and on-chain metrics are beginning to converge around a critical inflection point. Technical signals like the TD Sequential buy setup, liquidity absorption zones, and channel structure all point to a developing rebound scenario. Meanwhile, fundamental strength through network activity continues to validate investor confidence.
If Solana price successfully holds above $150 and reclaims $165 to $170, the path towards $180 opens for a short-term recovery. Sustained buying pressure from both technical participants and active users could confirm this bottoming structure, positioning Solana price for a potentially stronger recovery phase heading into the next market cycle.
